Gallery#
This page contains standalone examples of the functionality of hiveplotlib.
Click on any image to see the full image and source code.
For longer tutorials, see our Tutorials page.
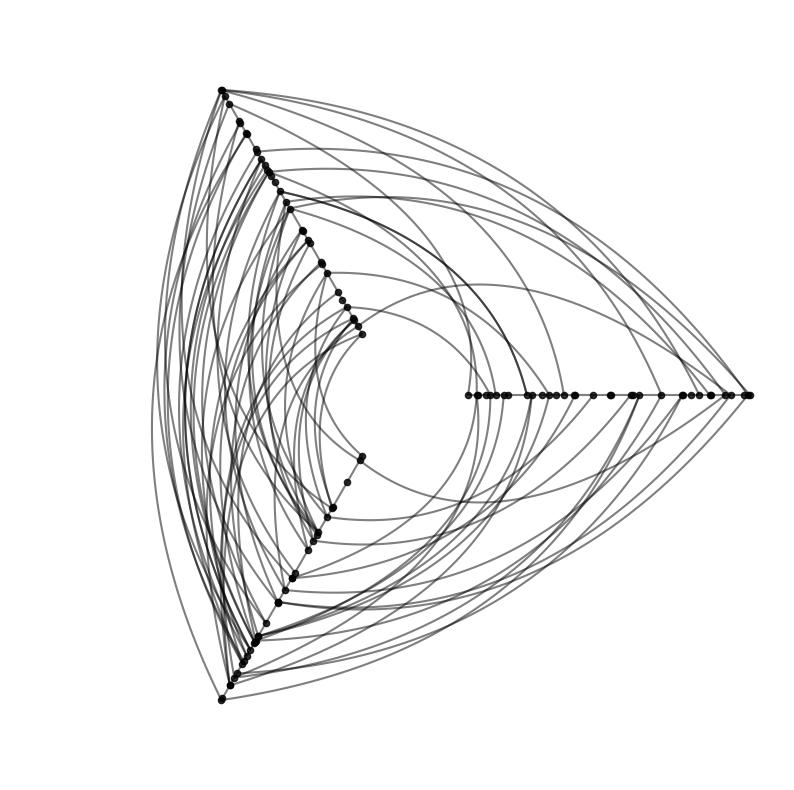
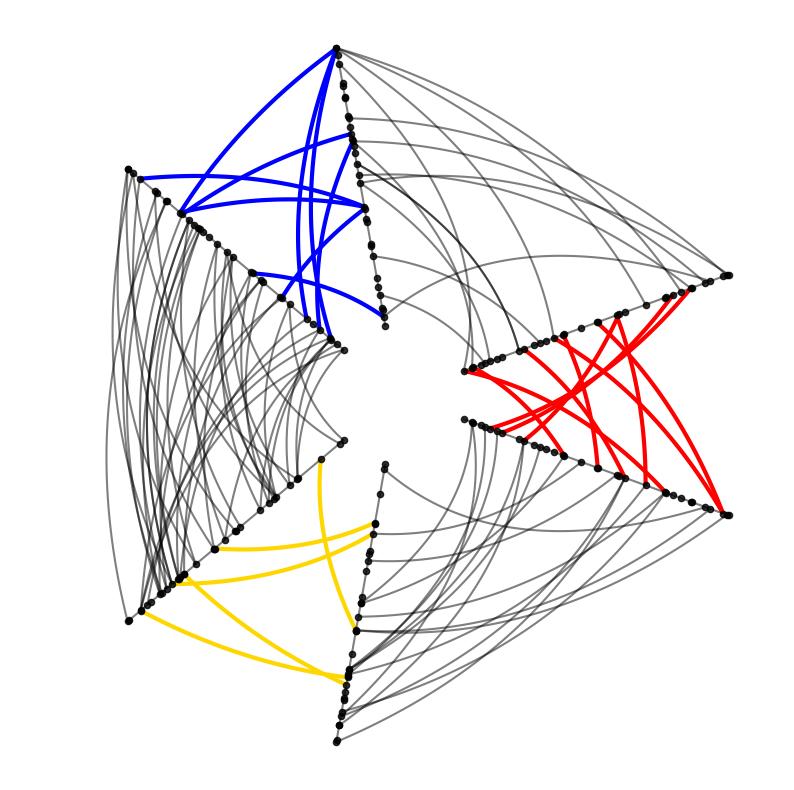
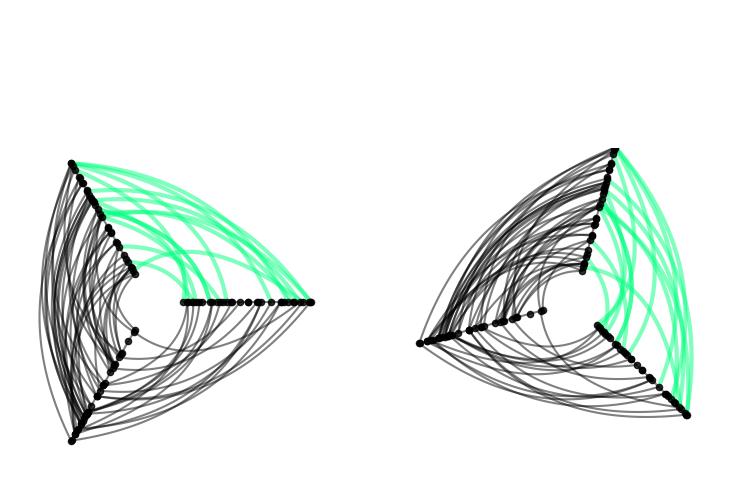
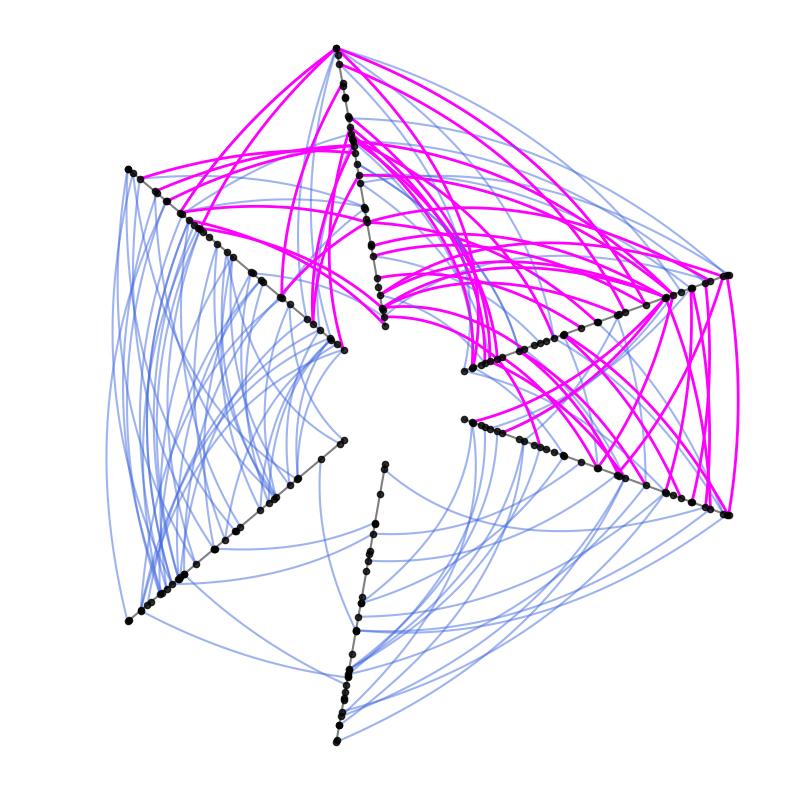
The HivePlot Class#
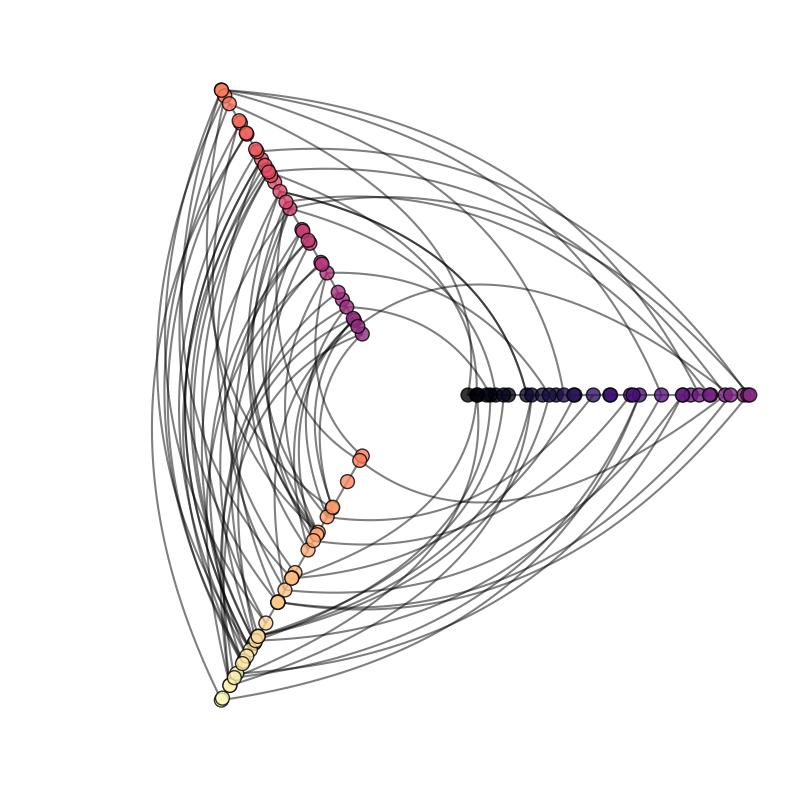
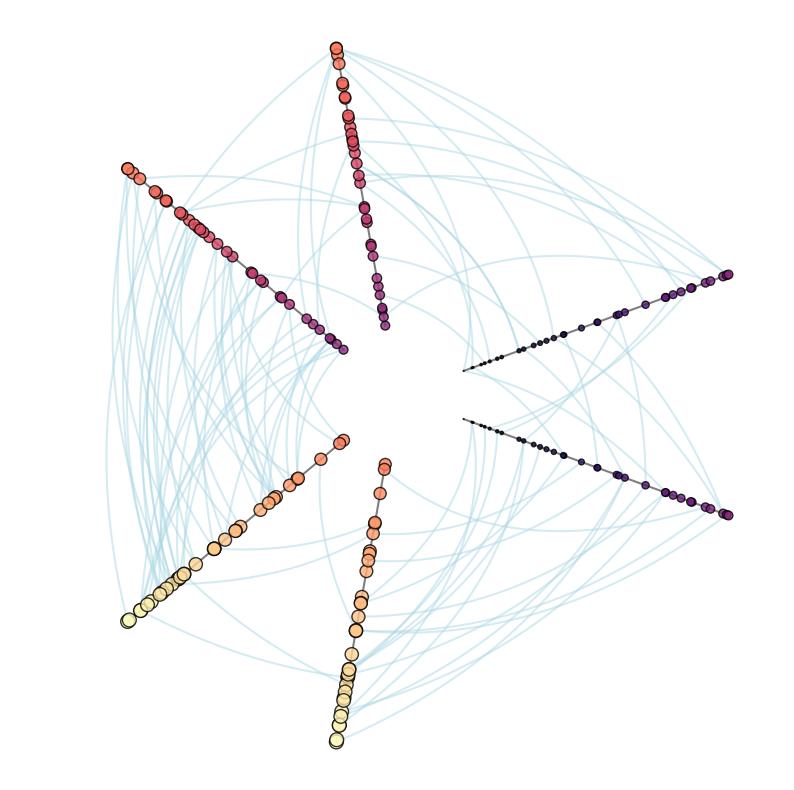
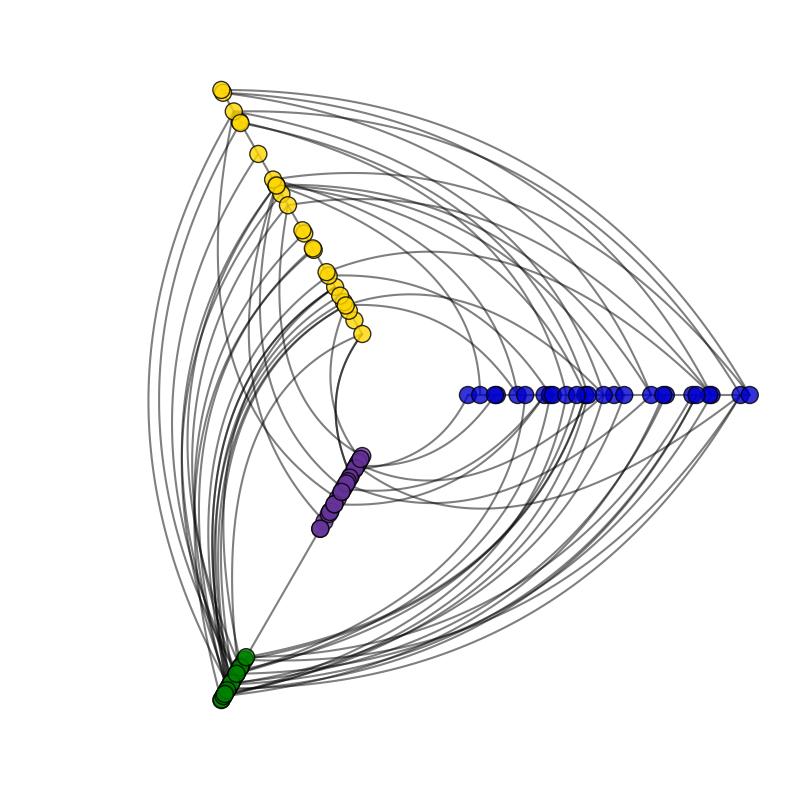
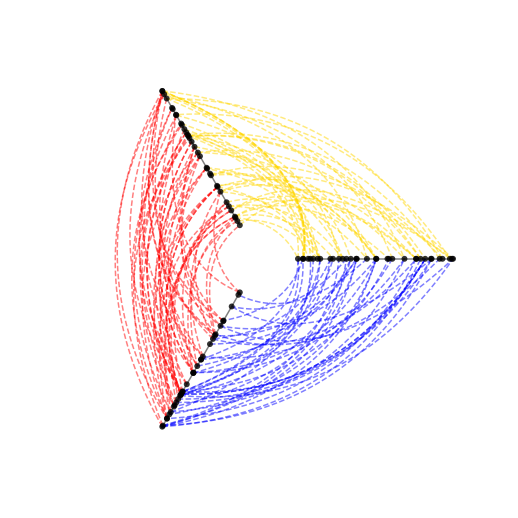
The NodeCollection Class#
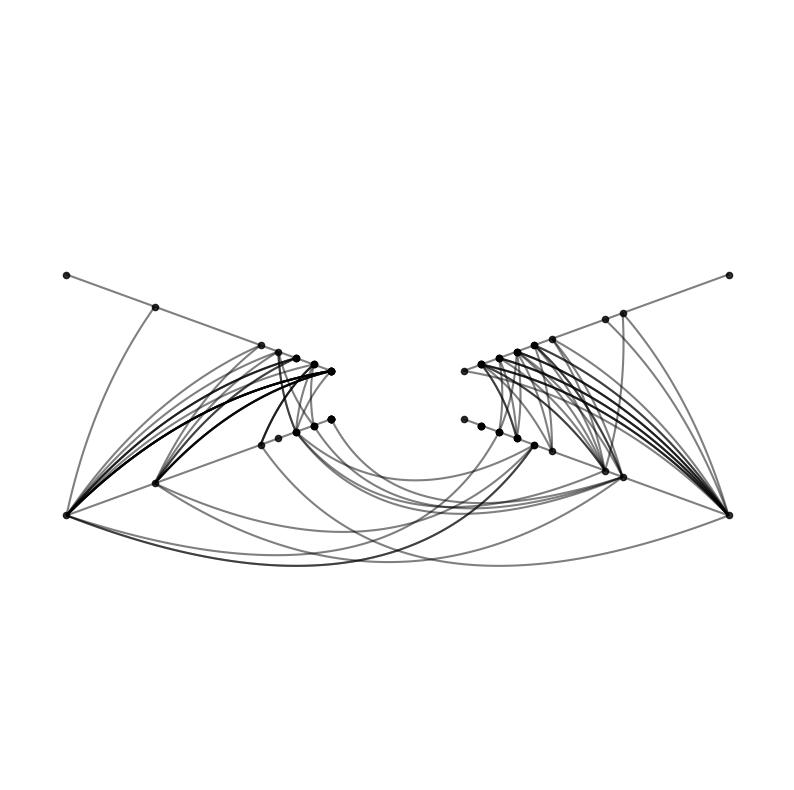
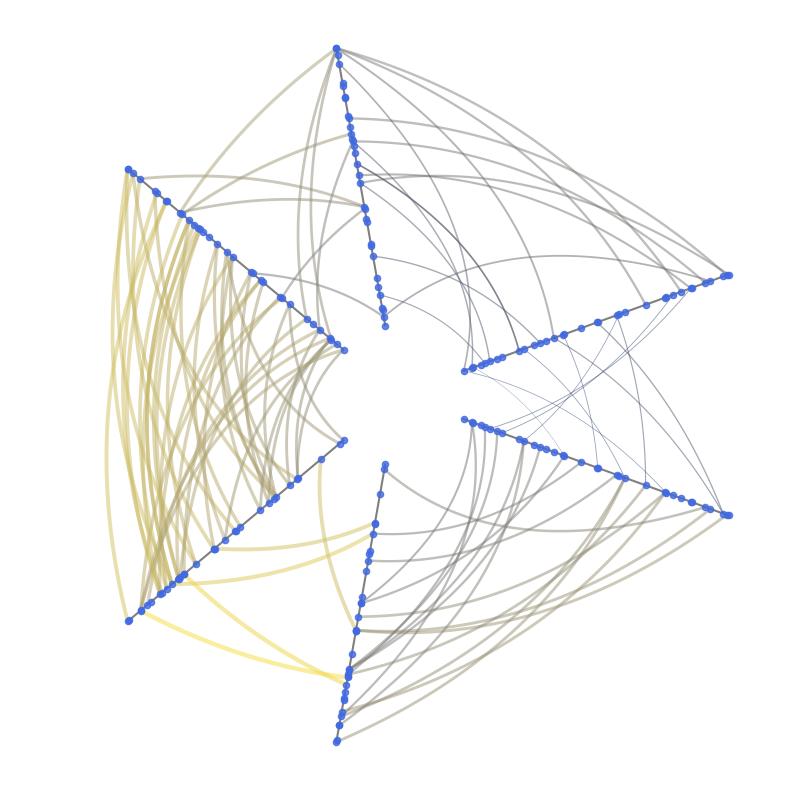
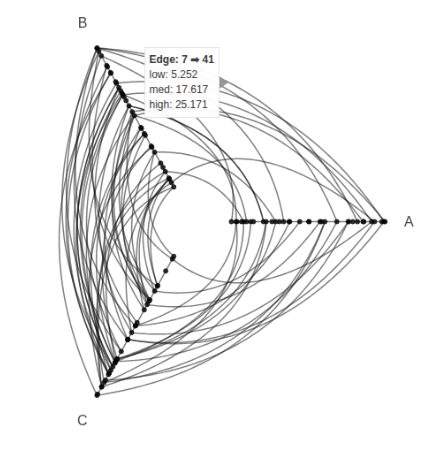
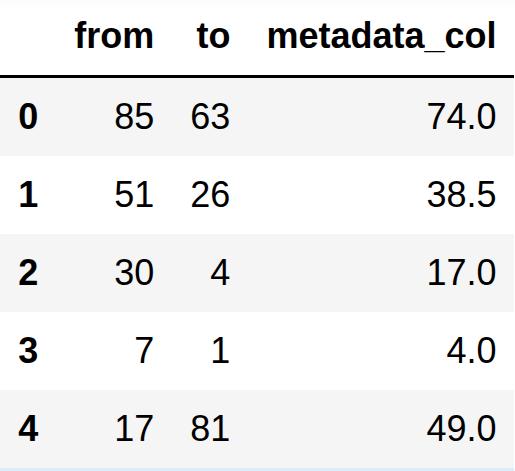
The Edges Class#
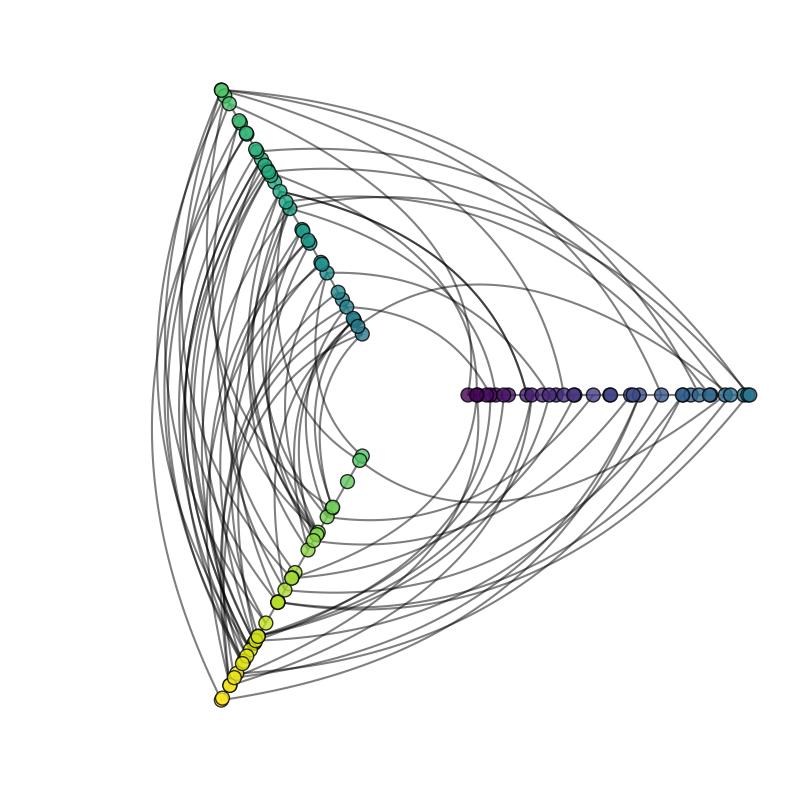
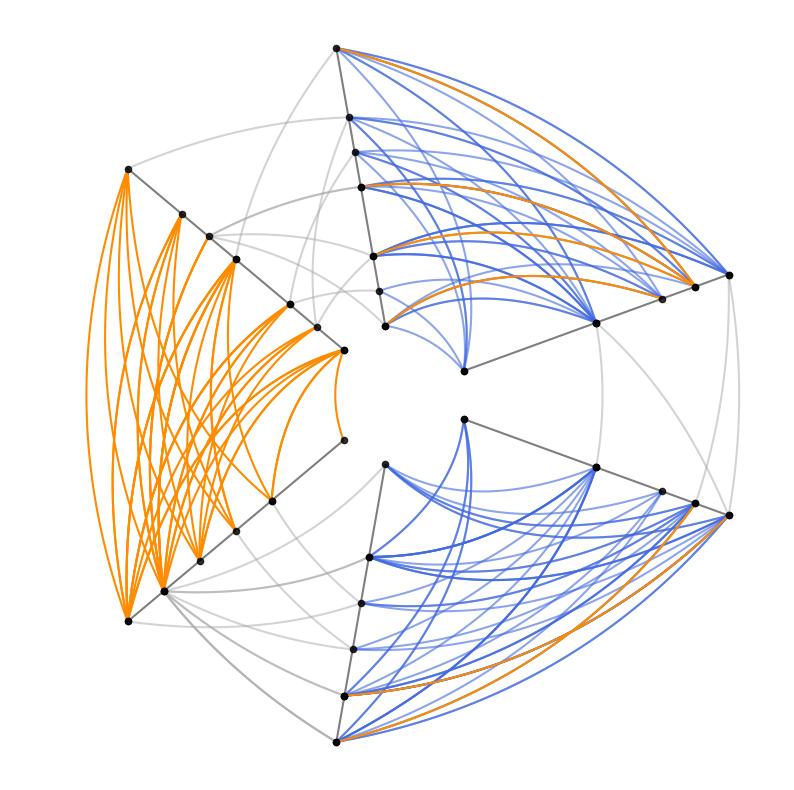
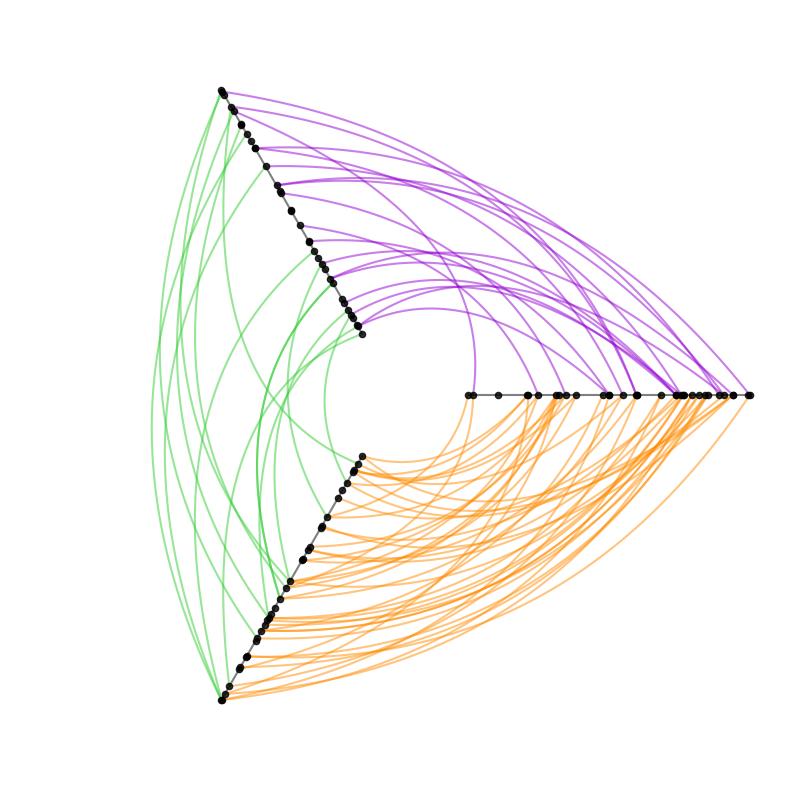
Visualization#
A deeper discussion about using the supported visualization backends.


Hive Plots from Different Data Sources#
Examples of how to convert different data sources into hive plots.