Ctrl+K
Creating hive plots is now easier and more flexible! Check out our blog post about the new hiveplotlib release.
Hiveplotlib documentation - Home Hiveplotlib documentation - Home
  • Tutorials
  • Gallery
  • API Reference
  • Blog
  • Releases
    • Roadmap
  • GitLab
  • Twitter
  • PyPI
  • Tutorials
  • Gallery
  • API Reference
  • Blog
  • Releases
  • Roadmap
  • GitLab
  • Twitter
  • PyPI

Section Navigation

Hive Plots

  • An Introduction to Hive Plots
  • Quick Start Hive Plots
  • Comparing Network Subgroups
  • Hive Plots for Large Networks
  • Hive Plots with More Than 3 Groups
  • Hive Plots Using Other Visualization Libraries

Hive Plot Examples

  • Zachary’s Karate Club
  • Networkx Examples
  • Bitcoin Trader Network

Polar Parallel Coordinates Plots

  • An Introduction to P2CPs
  • Scaling to Large P2CPs
  • P2CPs Using Other Visualization Libraries

P2CP Examples

  • 1996 American National Election Survey
  • Visualizing Correlations With P2CPs
  • Tutorials

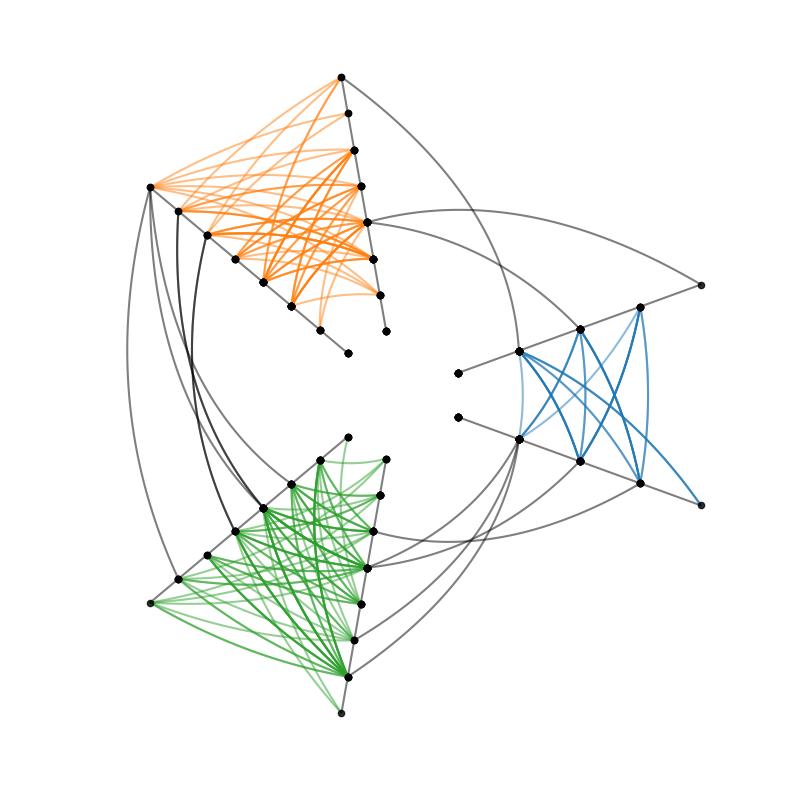
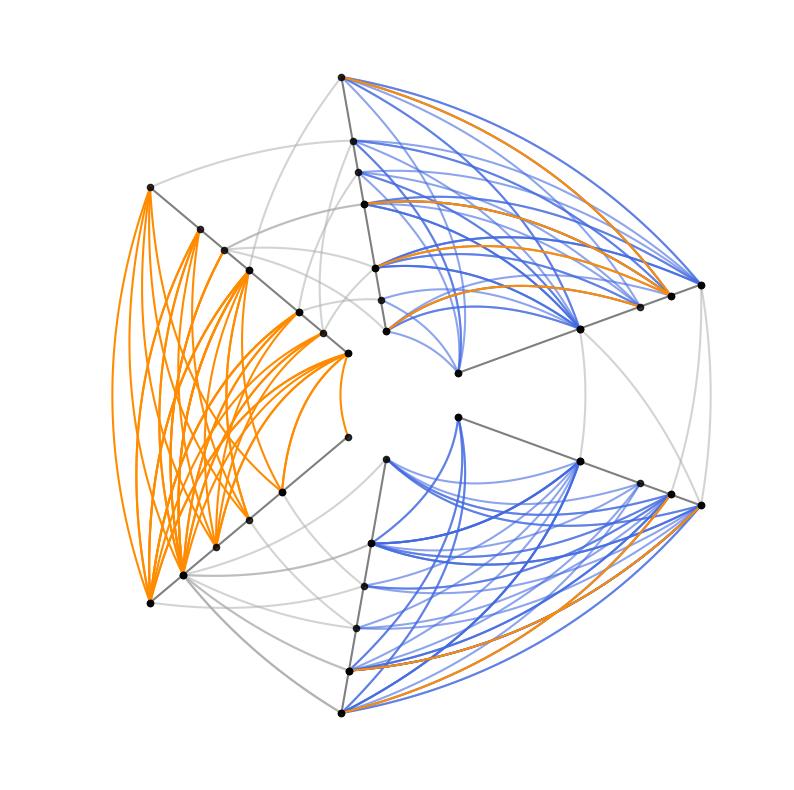
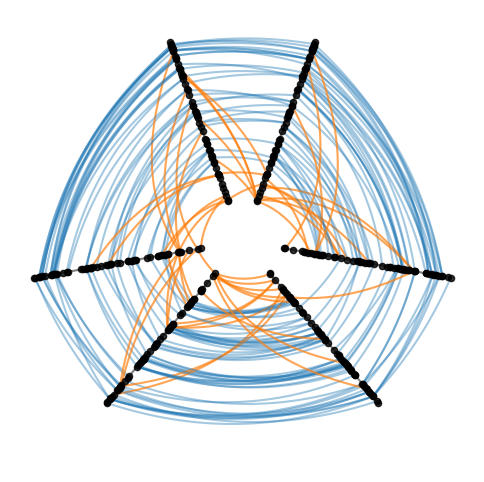
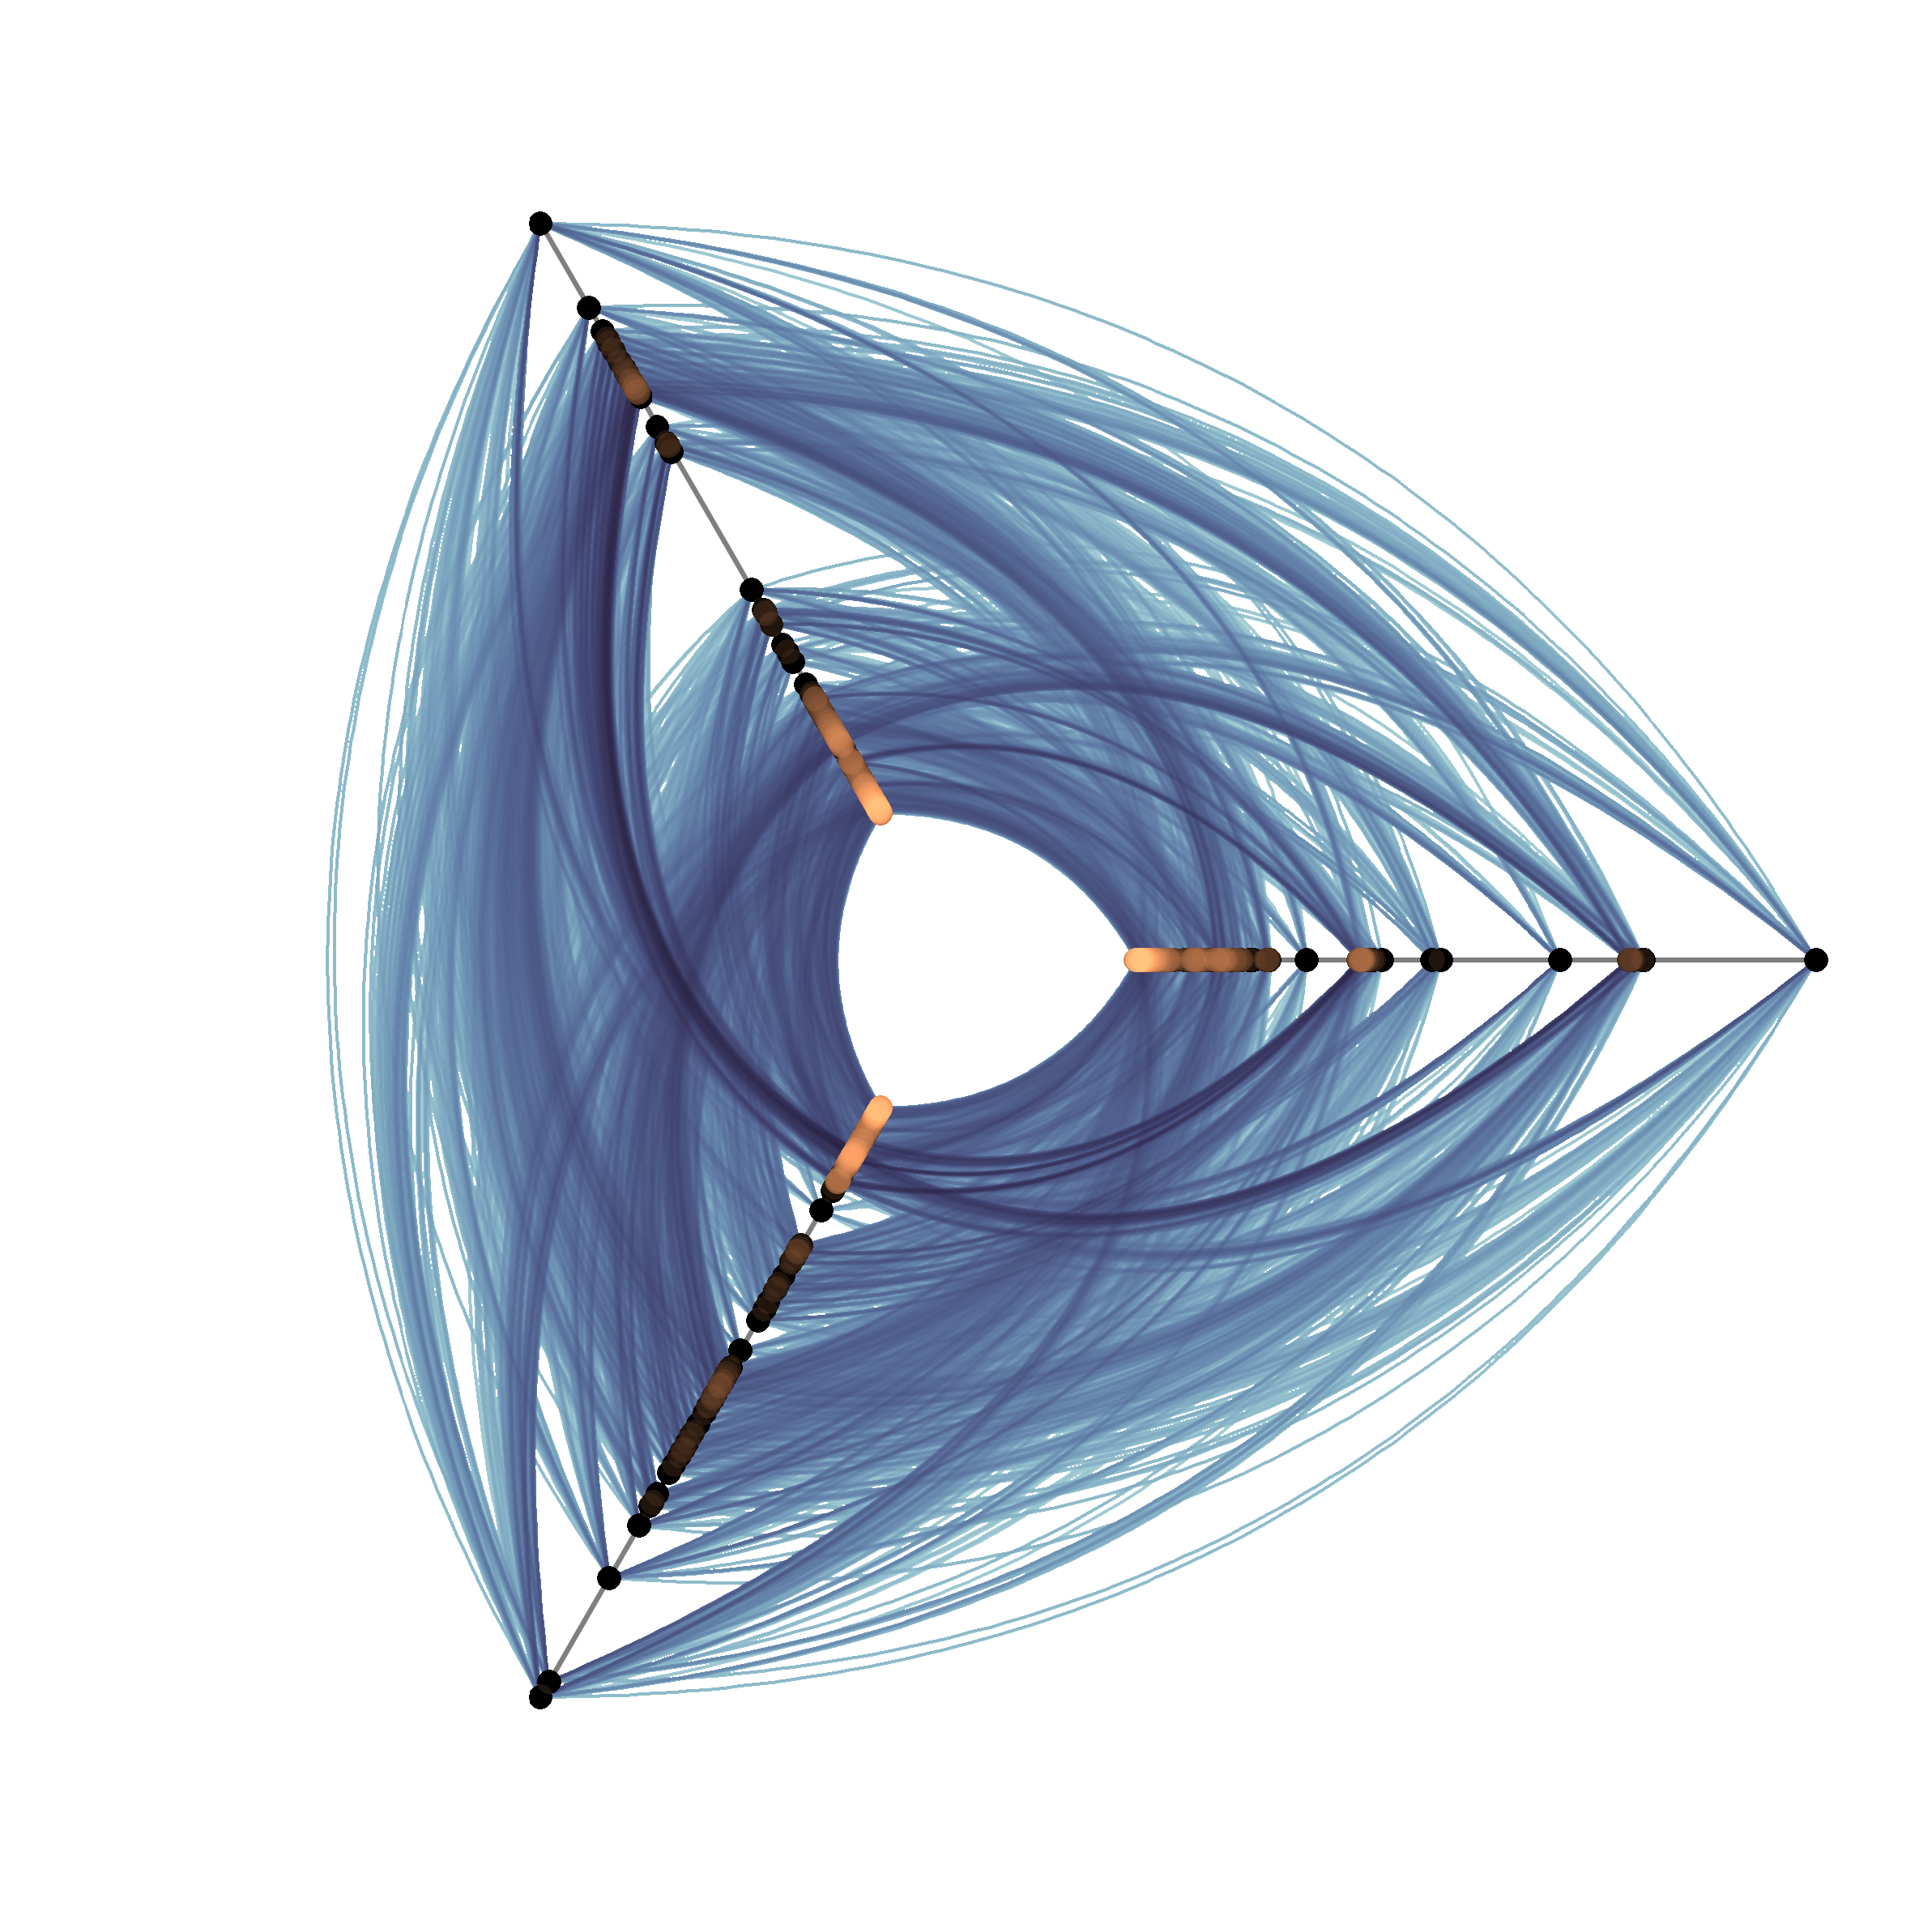
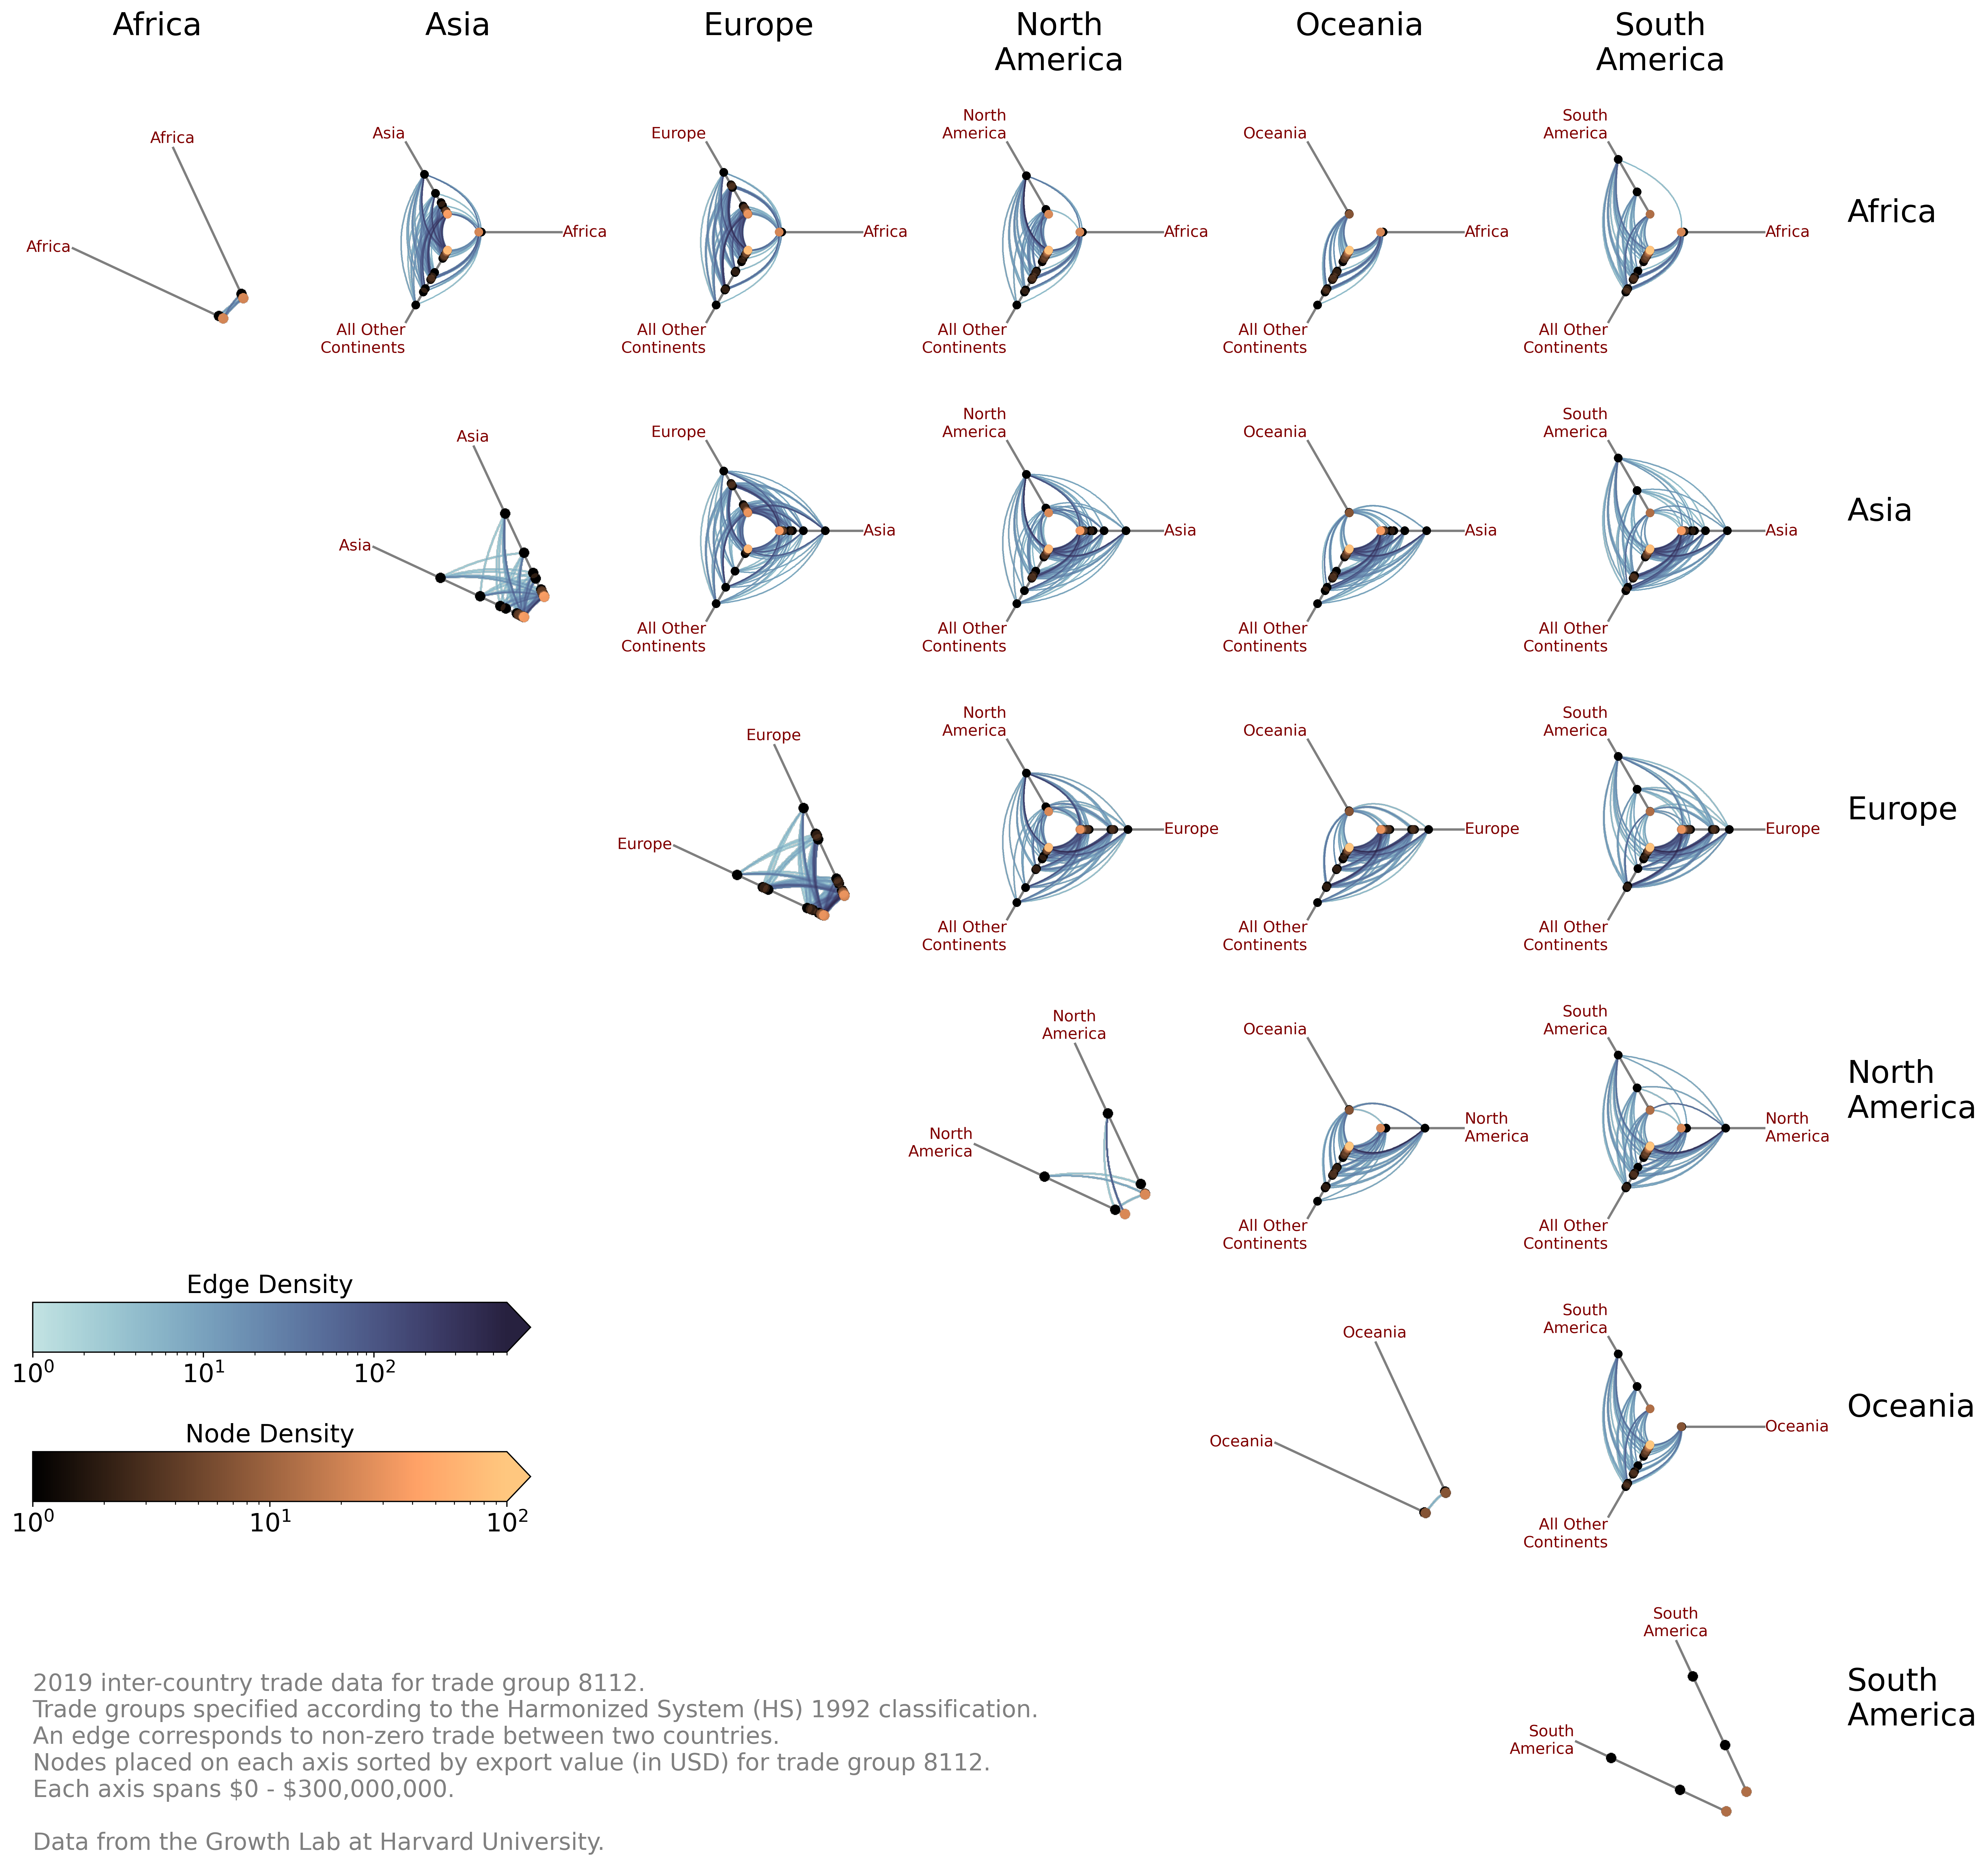
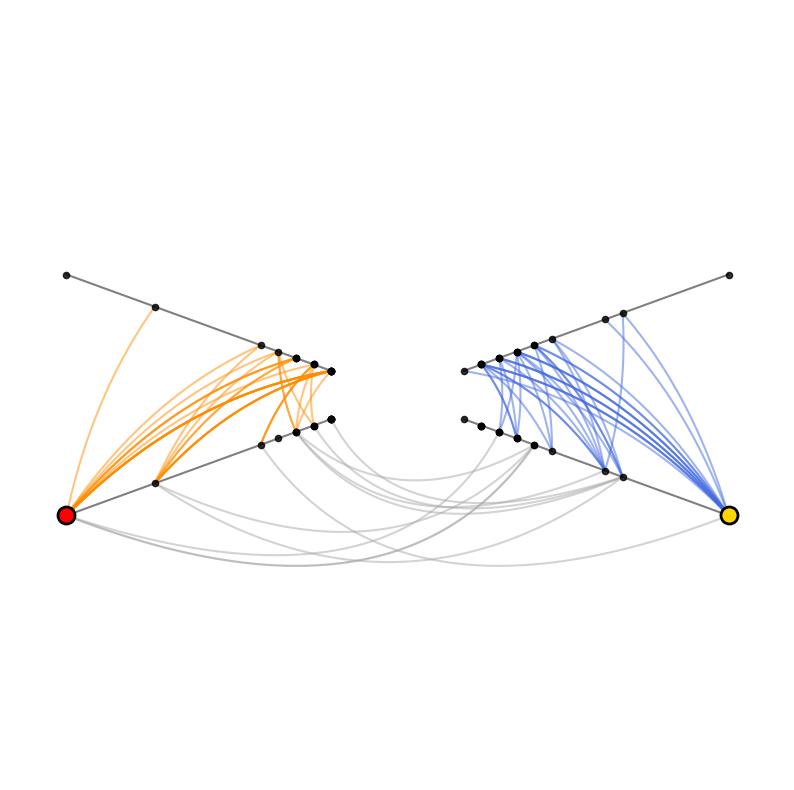
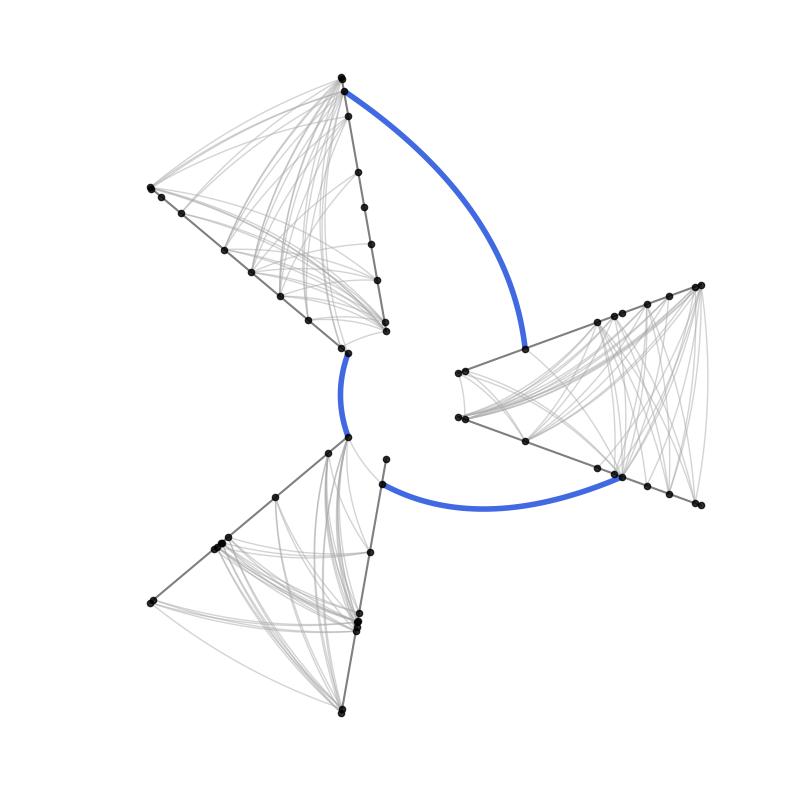
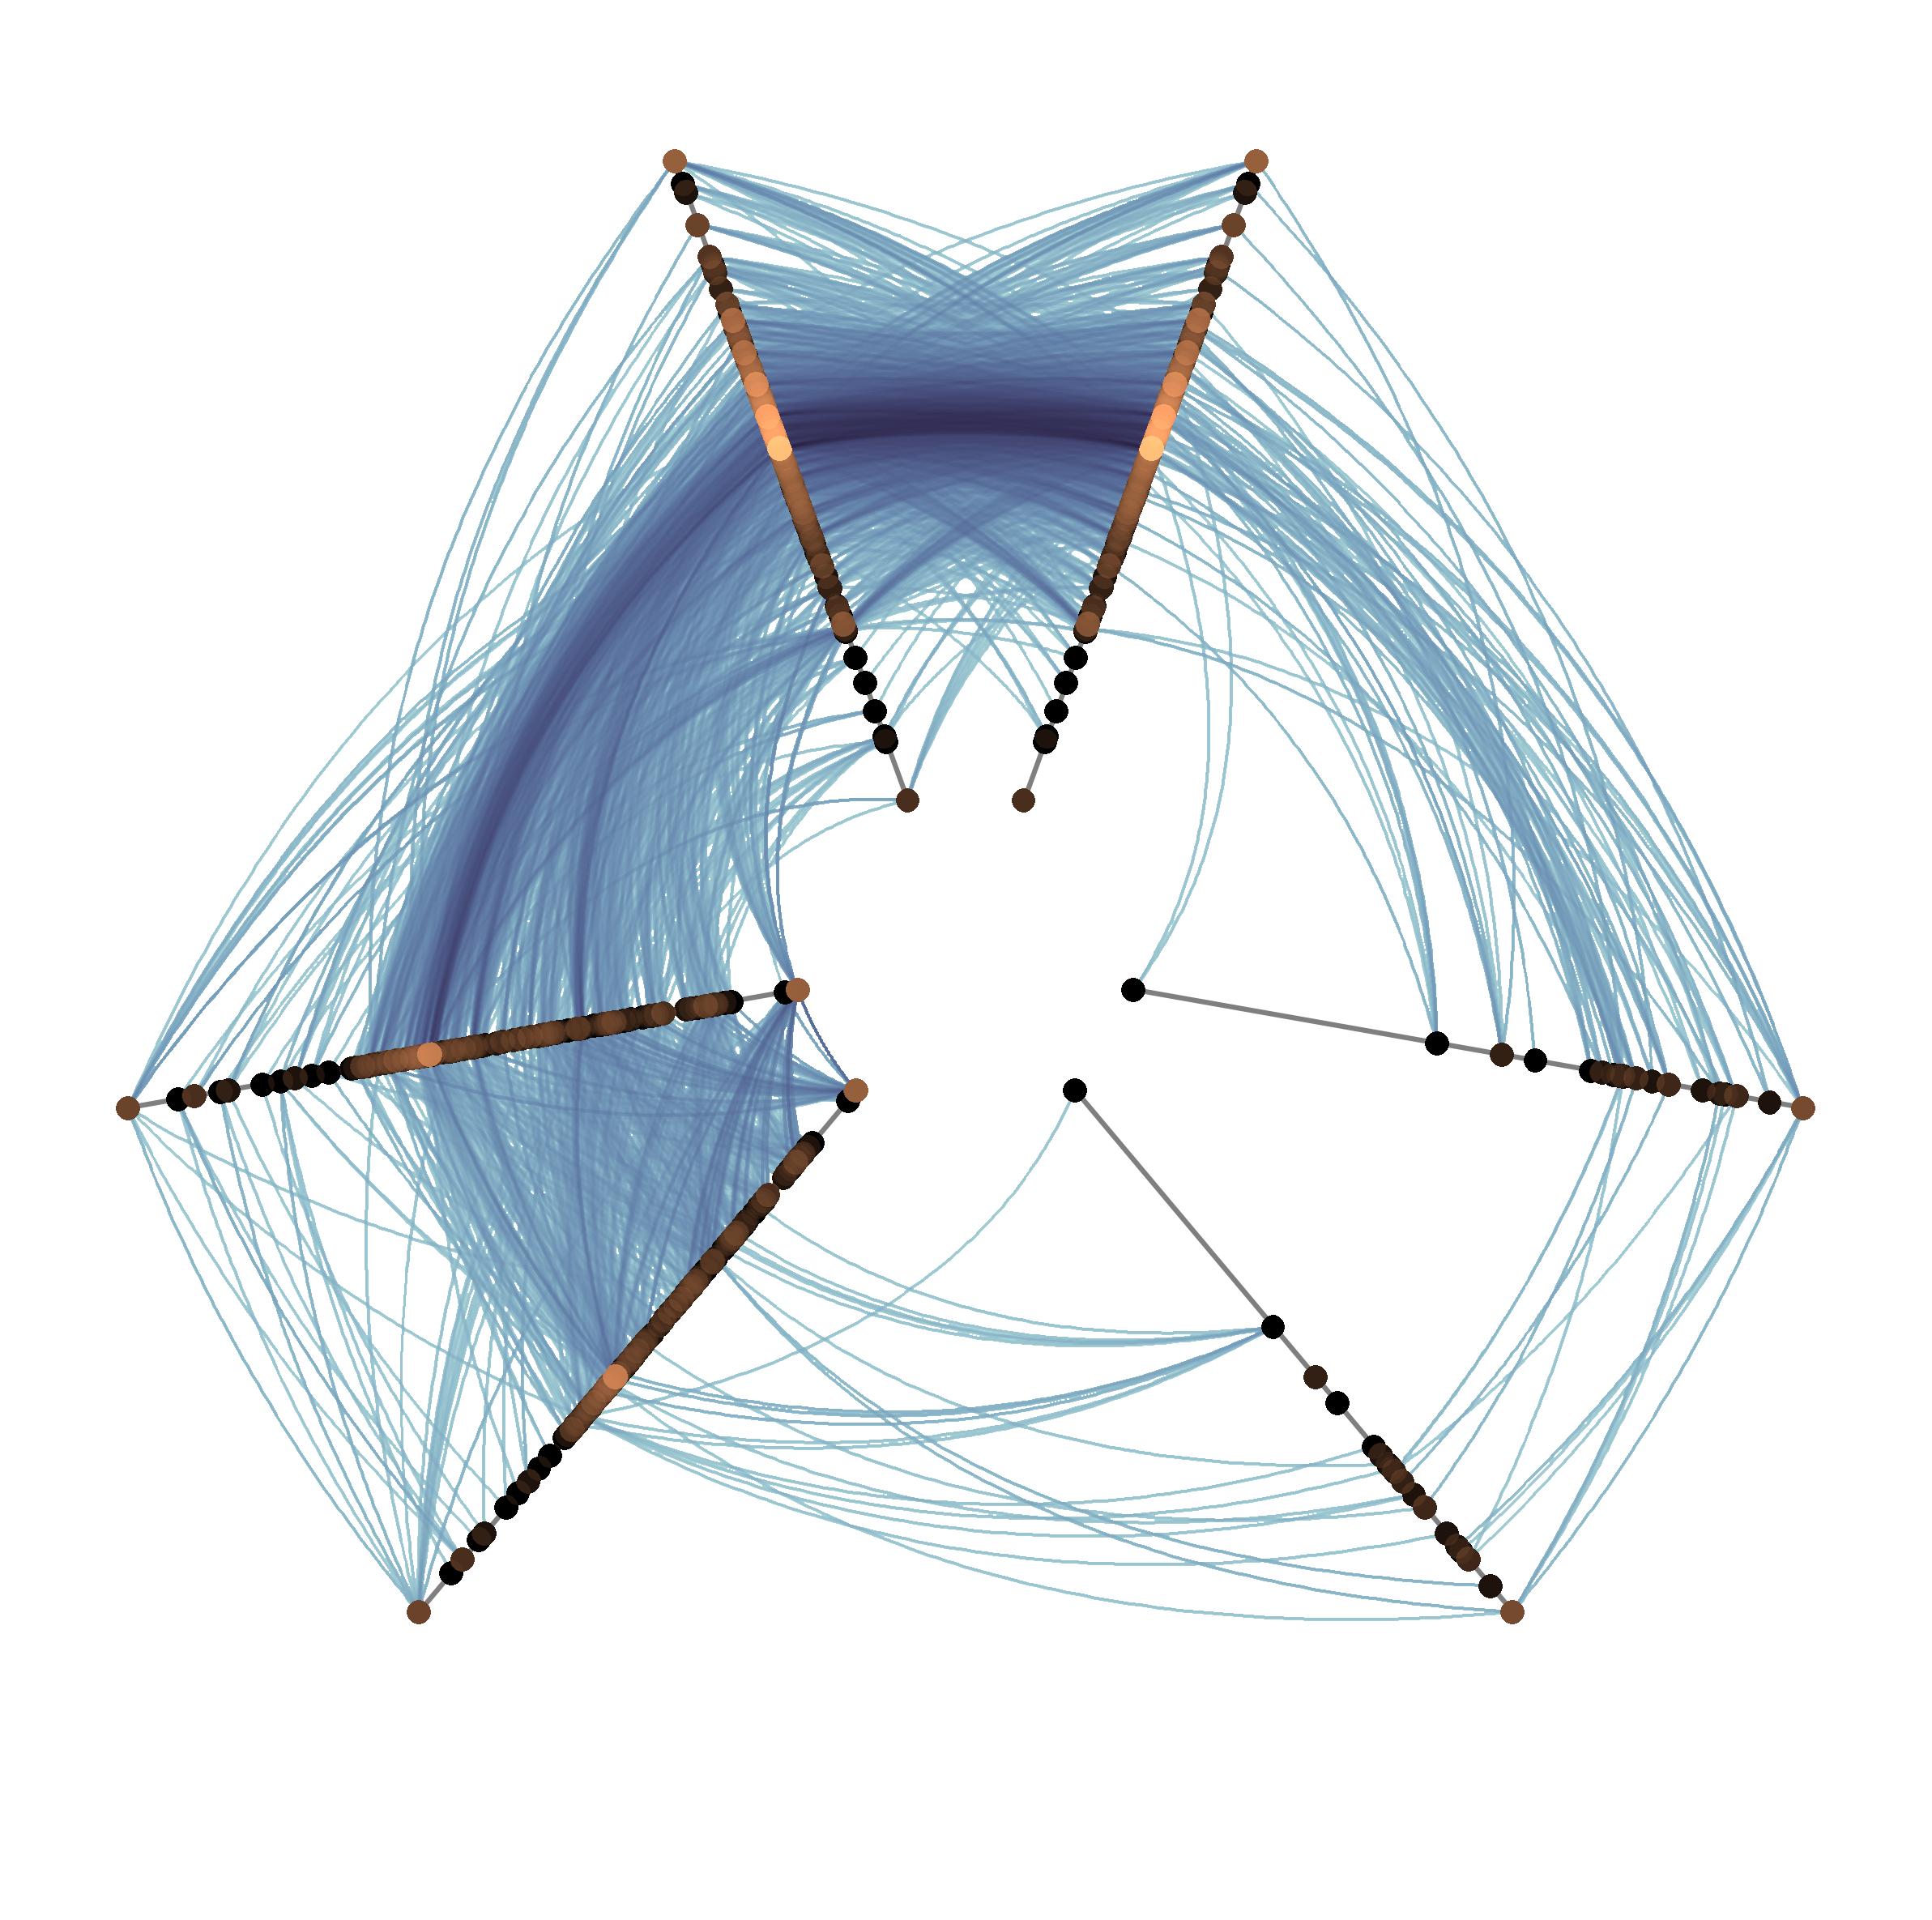
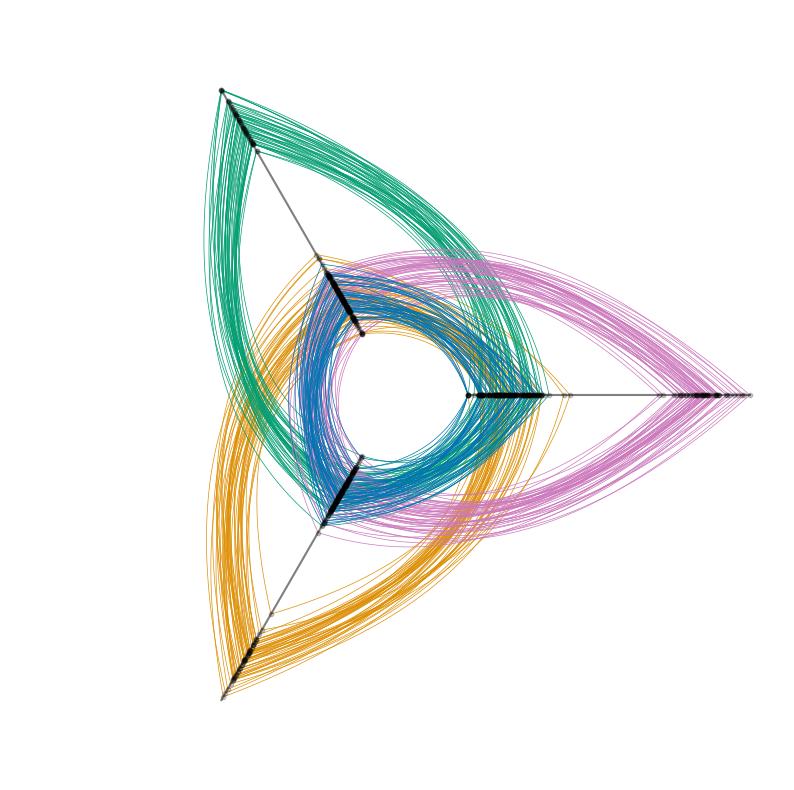
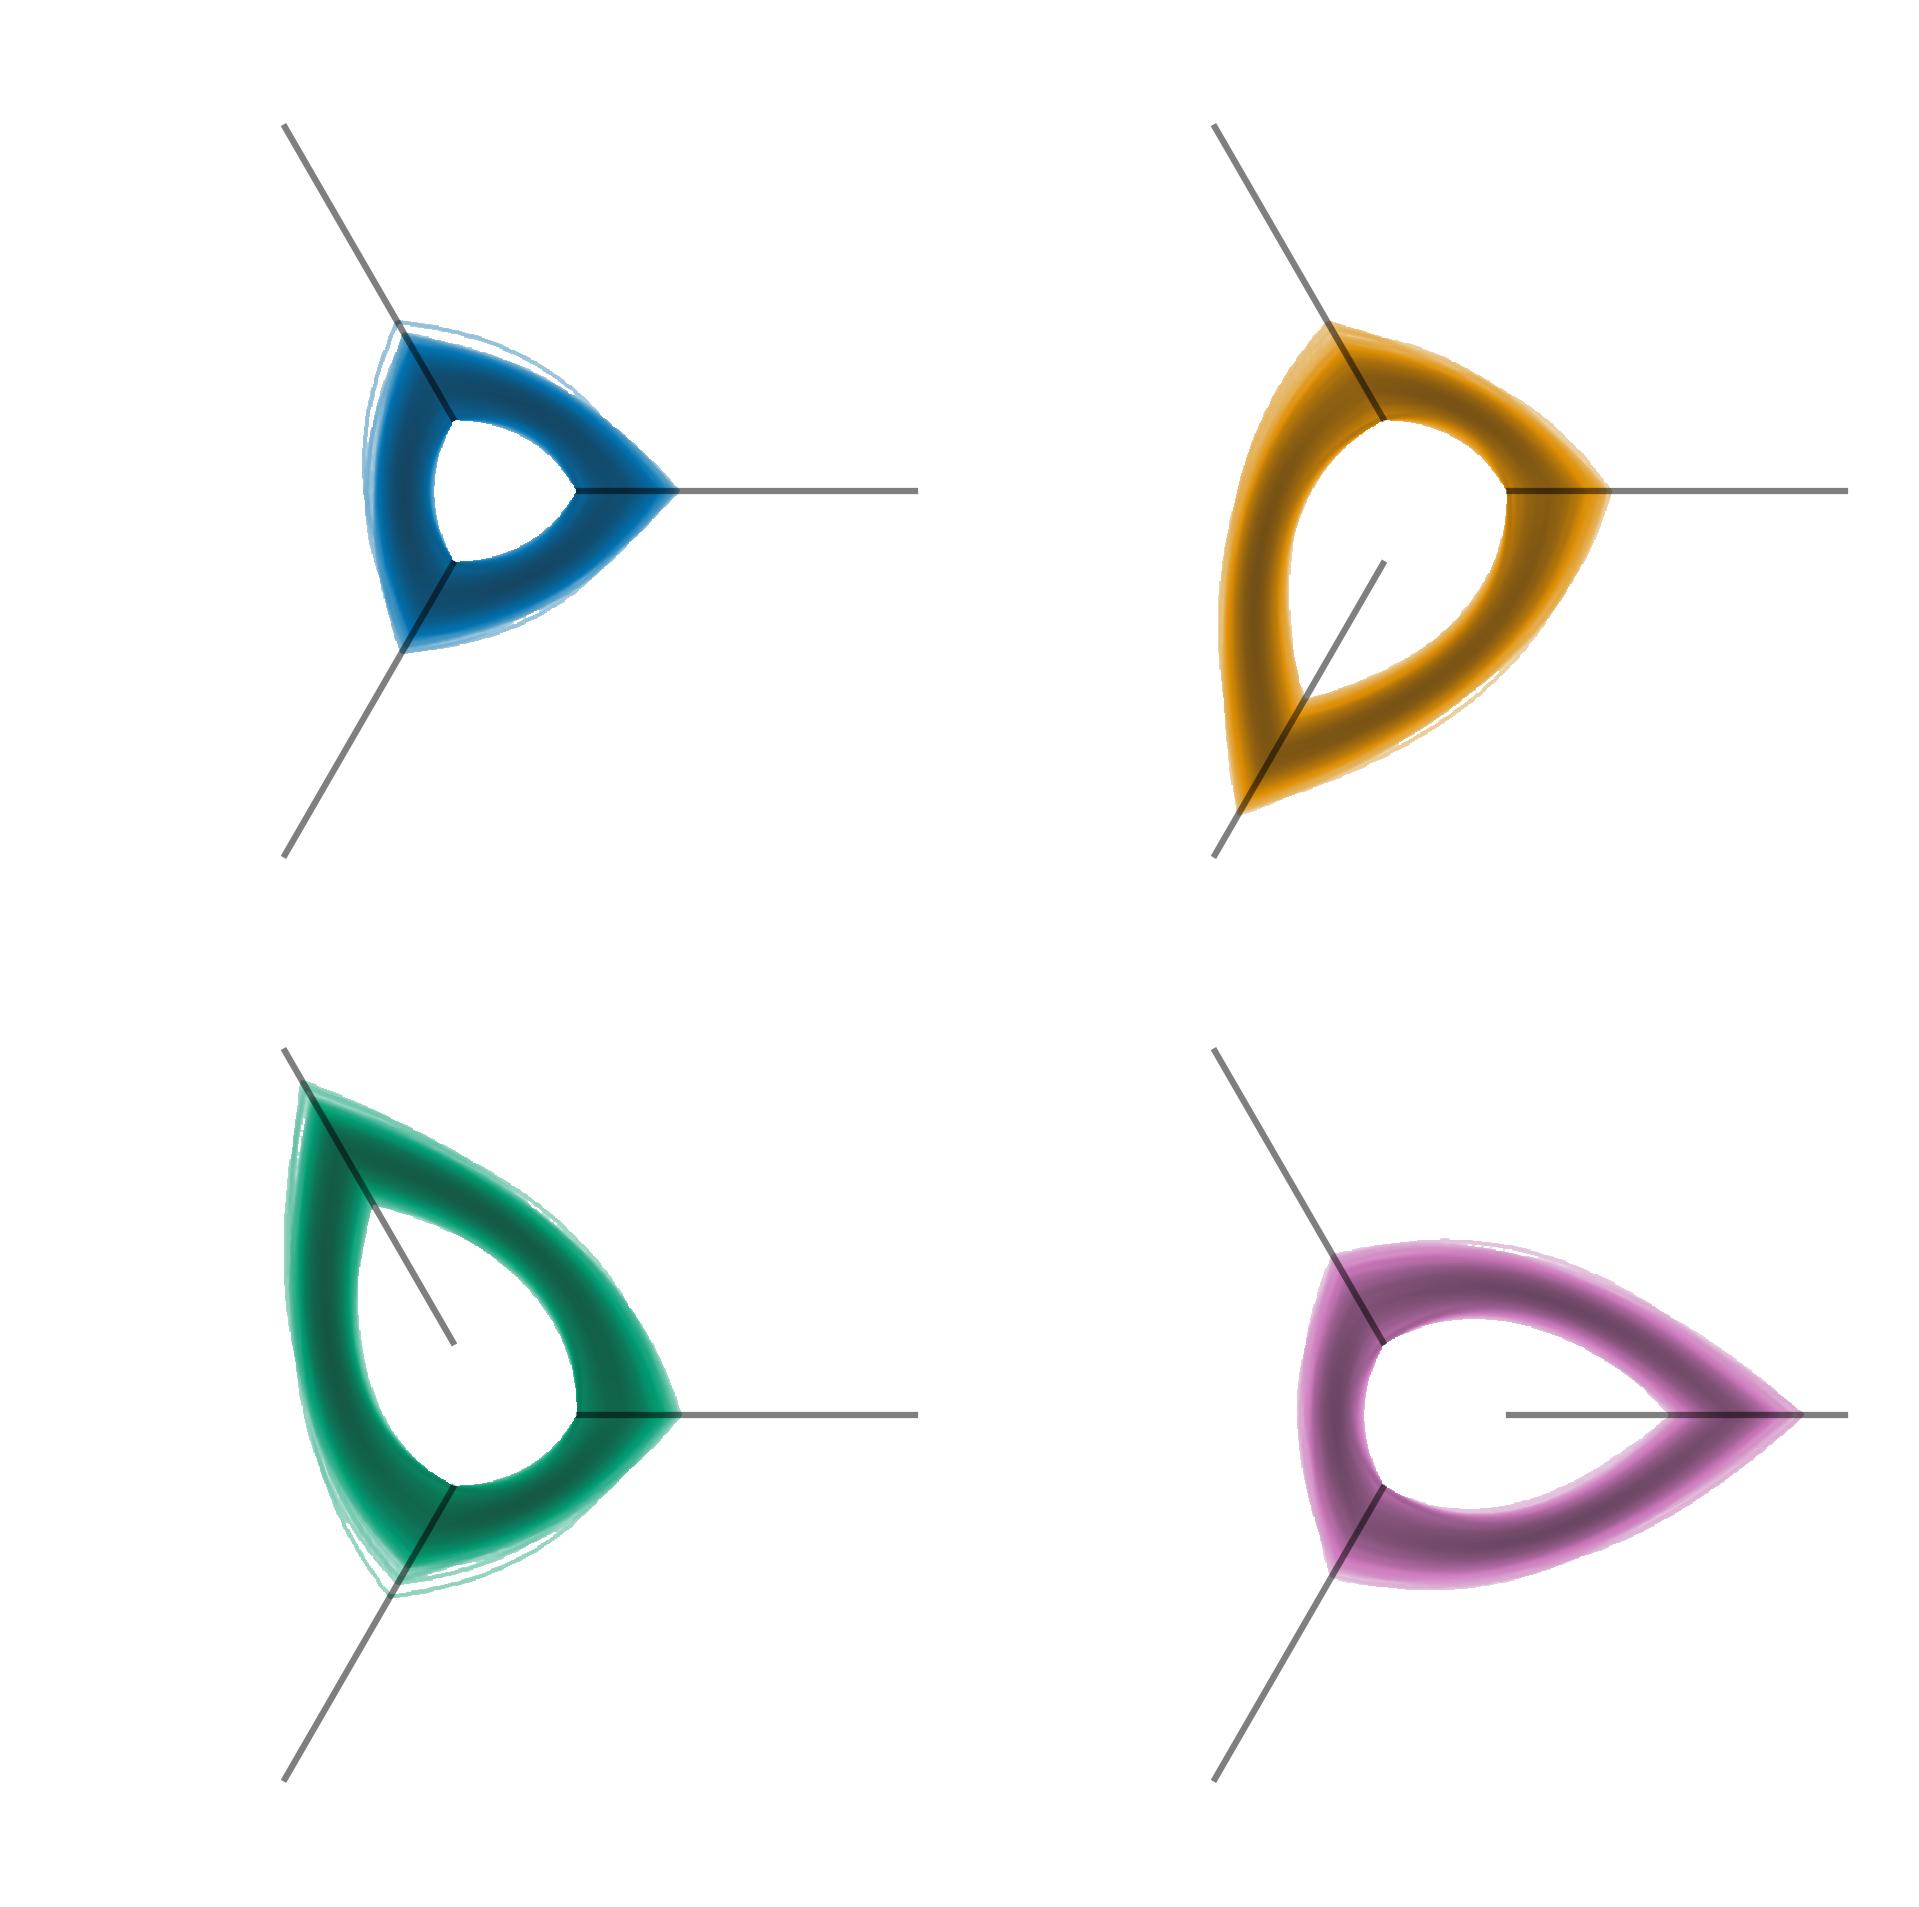
Tutorials#

These notebooks are longer-form explanations / discussions of the functionality of hiveplotlib.

Hive Plots#

An Introduction to Hive Plots
Quick Start Hive Plots
Comparing Network Subgroups
Hive Plots for Large Networks
Hive Plots with More Than 3 Groups
Hive Plots Using Other Visualization Libraries

Hive Plot Examples#

Zachary’s Karate Club
Networkx Examples
Bitcoin Trader Network

Polar Parallel Coordinates Plots#

An Introduction to P2CPs
Scaling to Large P2CPs
P2CPs Using Other Visualization Libraries

P2CP Examples#

1996 American National Election Survey
Visualizing Correlations With P2CPs

previous

Installation

next

An Introduction to Hive Plots

On this page
  • Hive Plots
  • Hive Plot Examples
  • Polar Parallel Coordinates Plots
  • P2CP Examples

© Copyright 2020 - 2025, Geometric Data Analytics.

Last updated on Dec 31, 2025.

Release Version: 0.26.2

Built with the PyData Sphinx Theme 0.16.1.

Created using Sphinx 8.2.3.