

Computing Graph Metrics#
Node and edge graph metrics are helpful both in hive plot construction and modification.
Hiveplotlib supports computing graph metrics via string names when initializing hive plots via the node_graph_metrics and edge_graph_metrics parameters. Users can also augment existing hive plots with graph metrics via the HivePlot.compute_graph_metrics() method.
This notebook demonstrates computing and using node and edge graph metrics for hive plots.
Note: this notebook requires that Hiveplotlib be installed with extra packages, which can be done by running:
pip install hiveplotlib[networkx]
[1]:
import matplotlib.pyplot as plt
import networkx as nx
from hiveplotlib import HivePlot
from hiveplotlib.datasets import example_hive_plot
from matplotlib.cm import ScalarMappable
from matplotlib.colors import Normalize
We will use Zachary’s Karate Club graph for the demonstrations below. For a longer-form discussion of this network, see the Zachary’s Karate Club tutorial.
[2]:
G = nx.karate_club_graph()
Available Node and Edge Metrics#
For the full list of supported node and edge metric string keys, along with a brief description and a link to each underlying algorithm, see the following tables in the API documentation:
Behind these string keys, Hiveplotlib calls the corresponding networkx functions with the requested arguments. If networkx is installed alongside a backend plugin like graphblas-algorithms, nx-parallel, or nx-cugraph, then we can route these metrics through that accelerated implementation. For more on how to redirect graph metric computation to these backends, see the Graph Metric Backends page.
Add Node Metrics When Initializing Hive Plot#
The node_graph_metrics parameter requests one or more node-level metrics at HivePlot initialization. The requested metrics are computed on an underlying networkx graph and attached as columns on HivePlot.nodes.data. They can be used immediately as the partition_variable or sorting_variables.
These plots set repeat_axes=True so that each group’s intra-group edges can be drawn (see Adding and Modifying Repeat Axes). With only two partition groups, this layout draws the inter-group edges between the two groups twice, once on each side of the figure, so one copy is redundant. We call HivePlot.reset_edges() to drop that duplicate set, leaving each inter-group connection drawn once and keeping the intra-group repeat-axis edges.
We request node degree below and use it as the sorting variable for all axes:
[3]:
hp = HivePlot(
    graph=G,
    partition_variable="club",
    sorting_variables="degree",  # will use node degree created by line below
    node_graph_metrics="degree",
    repeat_axes=True,
)

# drop the redundant inter-axis edge set (see the note above)
hp.reset_edges(axis_id_1="Mr. Hi_repeat", axis_id_2="Officer")

fig, ax = hp.plot()
ax.set_title(
    "Karate Club, nodes sorted by degree",
    y=0.8,
    size=20,
)
plt.show()
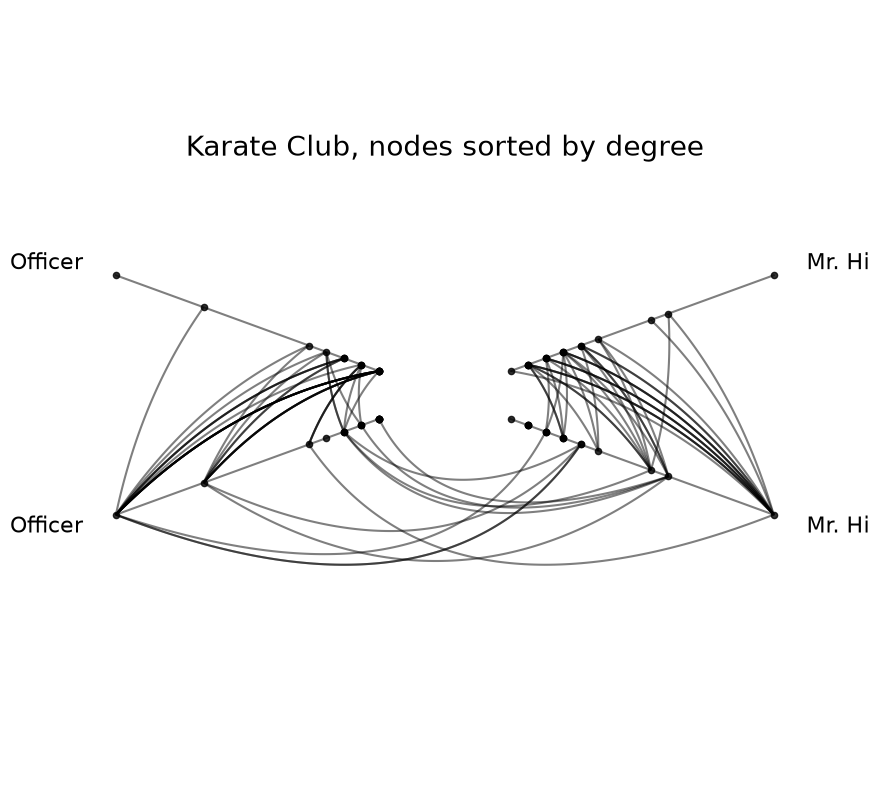
After instantiation of the HivePlot, the degree column is now a regular column in hp.nodes.data and behaves exactly like any other node attribute:
[4]:
hp.nodes.data.head()
[4]:
| unique_id | club | degree | |
|---|---|---|---|
| 0 | 0 | Mr. Hi | 16 |
| 1 | 1 | Mr. Hi | 9 |
| 2 | 2 | Mr. Hi | 10 |
| 3 | 3 | Mr. Hi | 6 |
| 4 | 4 | Mr. Hi | 3 |
Requesting Multiple Metrics at Once#
The node_graph_metrics parameter also accepts a list of metric names; each becomes its own column on HivePlot.nodes.data. Below, we request harmonic_centrality and average_neighbor_degree in one call:
[5]:
hp_multi = HivePlot(
    graph=G,
    partition_variable="club",
    sorting_variables="harmonic_centrality",
    node_graph_metrics=["harmonic_centrality", "average_neighbor_degree"],
    repeat_axes=True,
)
hp_multi.nodes.data.head()
[5]:
| unique_id | club | harmonic_centrality | average_neighbor_degree | |
|---|---|---|---|---|
| 0 | 0 | Mr. Hi | 23.166667 | 4.312500 |
| 1 | 1 | Mr. Hi | 19.166667 | 5.777778 |
| 2 | 2 | Mr. Hi | 21.000000 | 6.600000 |
| 3 | 3 | Mr. Hi | 17.666667 | 7.666667 |
| 4 | 4 | Mr. Hi | 14.666667 | 7.666667 |
Using a Computed Metric as a Partition Variable#
A computed graph metric can also serve as the partition variable. Since most metrics are continuous (or take many distinct values, for example node degree), they typically need to be discretized into bins via NodeCollection.create_partition_variable() before being used as a partition.
Building this discretization requires the NodeCollection to exist before the HivePlot is constructed, so for this use case, we’ll use the lower-level option for computing graph metrics:
First, if we’re starting from a
networkxgraph, we convert the graph vianetworkx_to_nodes_edges()toNodeCollectionandEdgesobjects. If we’re already starting from aNodeCollectionandEdges, then we can skip this step.Second, we attach the node graph metric via the standalone
hiveplotlib.graph_features.compute_graph_metrics()function.Third, we discretize our node graph metric by Creating a Partition Variable.
Finally, we build our hive plot using the
HivePlot()initialization.
Below, we partition Zachary’s Karate Club using node degree instead of club, first by discretizing node degree into three bins ("low", "medium", "high") and then using the resulting partition for the hive plot:
[6]:
from hiveplotlib.converters import networkx_to_nodes_edges
from hiveplotlib.graph_features import compute_graph_metrics

# convert the graph into hiveplotlib data structures
nodes, edges = networkx_to_nodes_edges(G)

# attach degree as a column on the NodeCollection
nodes, _ = compute_graph_metrics(
    G,
    node_metrics="degree",
    target_nodes=nodes,
)

# discretize for partitioning
degree_partition = nodes.create_partition_variable(
    data_column="degree",
    cutoffs=3,
    labels=["low", "medium", "high"],
)

hp_partition_by_degree = HivePlot(
    nodes=nodes,
    edges=edges,
    partition_variable=degree_partition,
    sorting_variables="degree",
    repeat_axes=True,
)

fig, ax = hp_partition_by_degree.plot()
ax.set_title(
    "Karate Club, partitioned by degree bin",
    y=1.05,
    size=20,
)
plt.show()
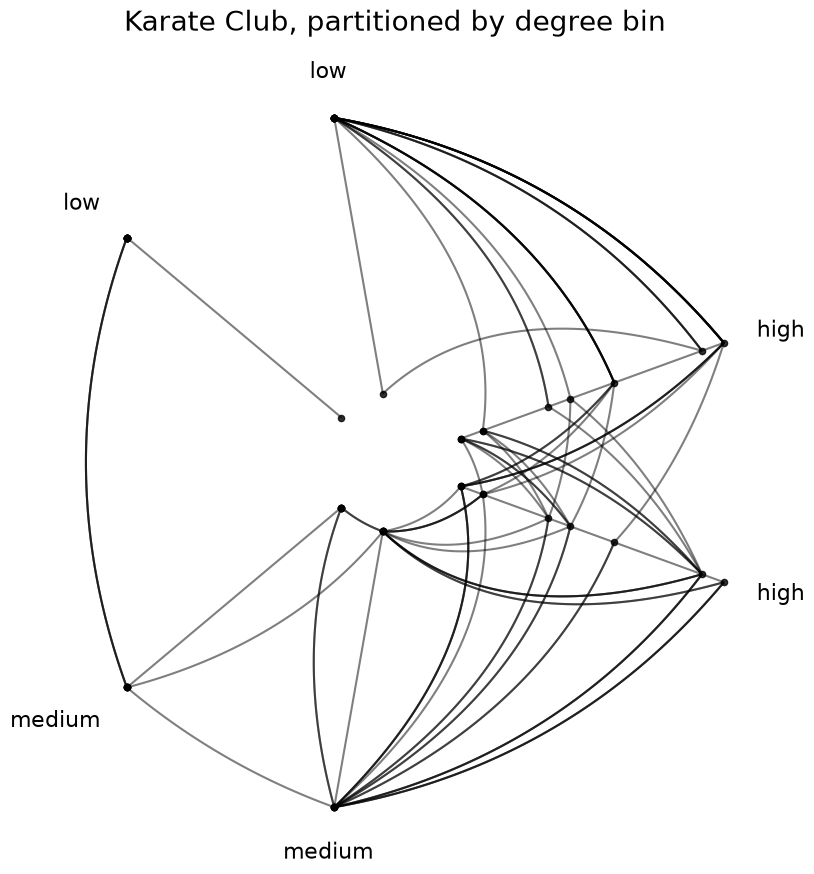
After construction, the discretized partition column appears on hp_partition_by_degree.nodes.data alongside the underlying degree column:
[7]:
hp_partition_by_degree.nodes.data.head()
[7]:
| unique_id | club | degree | partition_0 | |
|---|---|---|---|---|
| 0 | 0 | Mr. Hi | 16 | high |
| 1 | 1 | Mr. Hi | 9 | high |
| 2 | 2 | Mr. Hi | 10 | high |
| 3 | 3 | Mr. Hi | 6 | high |
| 4 | 4 | Mr. Hi | 3 | medium |
Add Edge Metrics When Initializing Hive Plot#
The edge_graph_metrics parameter requests one or more edge-level metrics at HivePlot initialization. The requested metrics are computed on an underlying networkx graph and attached as columns on Edges.data. They can drive edge styling via HivePlot.update_edge_plotting_keyword_arguments().
Below, we request edge_betweenness_centrality and use it to color edges:
[8]:
hp_edge = HivePlot(
    graph=G,
    partition_variable="club",
    sorting_variables="degree",
    node_graph_metrics="degree",  # used for node sorting only
    edge_graph_metrics="edge_betweenness_centrality",  # used below to color edges
    repeat_axes=True,
)

# drop the redundant inter-axis edge set
hp_edge.reset_edges(axis_id_1="Mr. Hi_repeat", axis_id_2="Officer")

edge_coloring_kwargs = {
    "cmap": "plasma",
    "clim": (0, 0.13),
    "alpha": 1,
}

# color edges by `edge_betweenness_centrality` value
hp_edge.update_edge_plotting_keyword_arguments(
    array="edge_betweenness_centrality",
    **edge_coloring_kwargs,
)

fig, ax = hp_edge.plot()

# add custom colorbar to plot
fig.colorbar(
    ScalarMappable(
        norm=Normalize(*edge_coloring_kwargs["clim"]),
        cmap=edge_coloring_kwargs["cmap"],
    ),
    orientation="horizontal",
    ax=ax,
    shrink=0.7,
    label="Edge Betweenness Centrality",
    pad=-0.2,
)

ax.set_title(
    "Karate Club, edges colored by edge betweenness centrality",
    y=0.75,
    size=20,
)
plt.show()
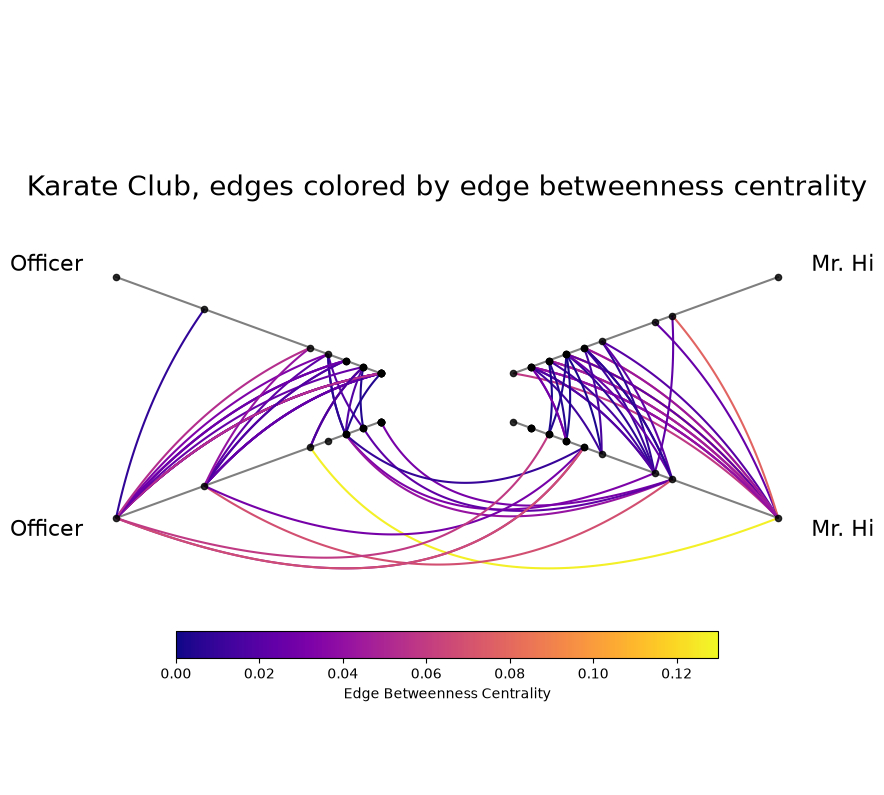
After instantiation of the HivePlot, the edge_betweenness_centrality column is now a regular column in hp_edge.edges.data and behaves exactly like any other edge attribute:
[9]:
hp_edge.edges.data.head()
[9]:
| from | to | weight | edge_betweenness_centrality | |
|---|---|---|---|---|
| 0 | 0 | 1 | 4 | 0.025253 |
| 1 | 0 | 2 | 5 | 0.077788 |
| 2 | 0 | 3 | 3 | 0.020499 |
| 3 | 0 | 4 | 3 | 0.052288 |
| 4 | 0 | 5 | 3 | 0.078134 |
Link Prediction Scores as an Edge Metric#
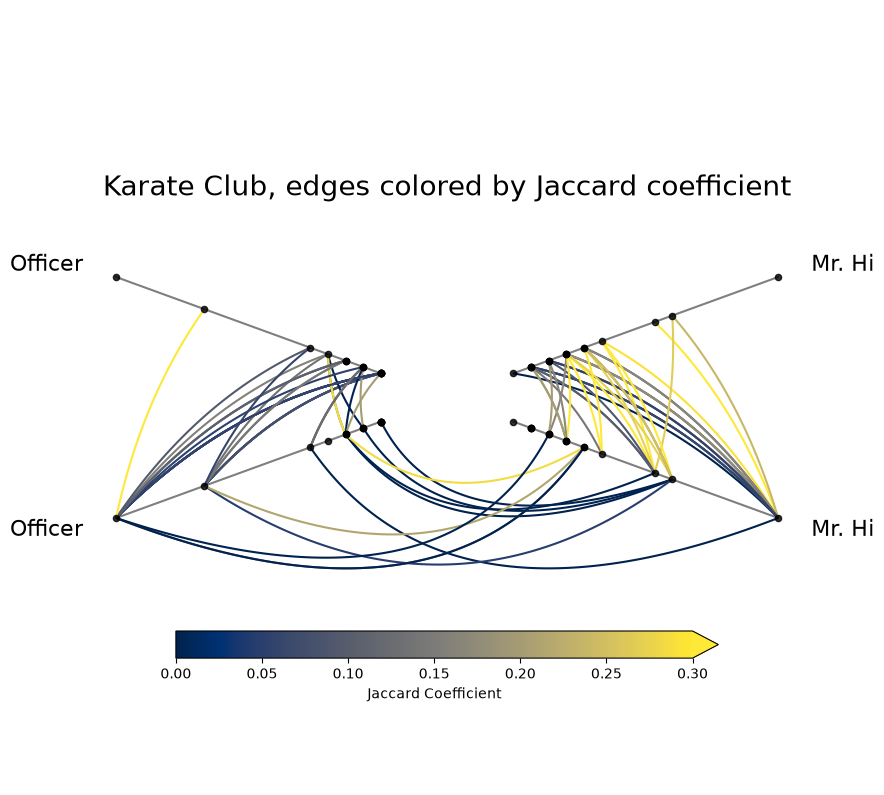
Link-prediction metrics like jaccard_coefficient, adamic_adar_index, and preferential_attachment score node pairs by how likely they are to share an edge. NetworkX intends these scores for non-edges (predicting where missing edges might exist), but Hiveplotlib applies the score to every existing edge in the graph by default. The result is a per-edge link-likelihood annotation we can use to color edges, highlighting which existing connections are well-supported by neighborhood
structure.
Below, we request jaccard_coefficient and color edges by the resulting score:
[10]:
hp_jaccard = HivePlot(
    graph=G,
    partition_variable="club",
    sorting_variables="degree",
    node_graph_metrics="degree",
    edge_graph_metrics="jaccard_coefficient",
    repeat_axes=True,
)

# drop the redundant inter-axis edge set
hp_jaccard.reset_edges(axis_id_1="Mr. Hi_repeat", axis_id_2="Officer")

jaccard_coloring_kwargs = {
    "cmap": "cividis",
    "clim": (0, 0.3),
    "alpha": 1,
}

hp_jaccard.update_edge_plotting_keyword_arguments(
    array="jaccard_coefficient",
    **jaccard_coloring_kwargs,
)

fig, ax = hp_jaccard.plot()

fig.colorbar(
    ScalarMappable(
        norm=Normalize(*jaccard_coloring_kwargs["clim"]),
        cmap=jaccard_coloring_kwargs["cmap"],
    ),
    orientation="horizontal",
    ax=ax,
    shrink=0.7,
    label="Jaccard Coefficient",
    pad=-0.2,
    extend="max",
)

ax.set_title(
    "Karate Club, edges colored by Jaccard coefficient",
    y=0.75,
    size=20,
)
plt.show()
See the link-prediction wrappers in the Edge Metric Table for the full set of supported algorithms.
Per-Metric Keyword Arguments#
Some networkx algorithms accept additional keyword arguments. For example, node betweenness_centrality accepts k to sample only k source nodes for an approximate result (much faster on large graphs).
The node_graph_metric_kwargs and edge_graph_metric_kwargs parameters allow us to pass along per-metric kwargs:
[11]:
hp_sampled = HivePlot(
    graph=G,
    partition_variable="club",
    sorting_variables="degree",
    node_graph_metrics=["degree", "betweenness_centrality"],
    node_graph_metric_kwargs={
        "betweenness_centrality": {
            "k": 10,  # sample this many neighbors for each node
            "seed": 0,  # replicate the same answer each time
        },
    },
    repeat_axes=True,
)
hp_sampled.nodes.data.head()
[11]:
| unique_id | club | degree | betweenness_centrality | |
|---|---|---|---|---|
| 0 | 0 | Mr. Hi | 16 | 0.404596 |
| 1 | 1 | Mr. Hi | 9 | 0.020491 |
| 2 | 2 | Mr. Hi | 10 | 0.155503 |
| 3 | 3 | Mr. Hi | 6 | 0.024132 |
| 4 | 4 | Mr. Hi | 3 | 0.000000 |
Graph metrics that do not accept keyword arguments (e.g. degree, in_degree, out_degree, core_number) raise a TypeError if you pass kwargs to them:
[12]:
import traceback

try:
    HivePlot(
        graph=G,
        partition_variable="club",
        sorting_variables="degree",
        node_graph_metrics="degree",
        node_graph_metric_kwargs={"degree": {"k": 10}},
    )
except TypeError:
    traceback.print_exc()
Traceback (most recent call last):
  File "/tmp/ipykernel_1890079/2637327395.py", line 4, in <module>
    HivePlot(
  File "/home/garyk/repos/hiveplotlib/src/hiveplotlib/hiveplot.py", line 2264, in __init__
    self._apply_graph_metrics(
  File "/home/garyk/repos/hiveplotlib/src/hiveplotlib/hiveplot.py", line 2478, in _apply_graph_metrics
    new_nodes, new_edges = compute_graph_metrics(
                           ^^^^^^^^^^^^^^^^^^^^^^
  File "/home/garyk/repos/hiveplotlib/src/hiveplotlib/graph_features/__init__.py", line 761, in compute_graph_metrics
    _run_metric(
  File "/home/garyk/repos/hiveplotlib/src/hiveplotlib/graph_features/__init__.py", line 447, in _run_metric
    return wrapper(graph, **metric_kwargs)
           ^^^^^^^^^^^^^^^^^^^^^^^^^^^^^^^
TypeError: degree() got an unexpected keyword argument 'k'
The node and edge graph metrics tables (linked at the top of this notebook) note which metrics accept kwargs.
Add Node and Edge Graph Metrics to Existing Hive Plot#
On an existing HivePlot, the HivePlot.compute_graph_metrics() method supports adding one or more node and / or edge metrics to the respective nodes and edges attributes in place.
[13]:
# pre-build the Karate Club hive plot like above
hp_existing = HivePlot(
    graph=G,
    partition_variable="club",
    sorting_variables="degree",
    node_graph_metrics="degree",
)
[14]:
hp_existing.compute_graph_metrics(
    node_graph_metrics=["pagerank", "betweenness_centrality"],
    edge_graph_metrics="edge_load_centrality",
)
The two added node graph metrics become columns in the node data just like degree.
[15]:
hp_existing.nodes.data.head()
[15]:
| unique_id | club | degree | pagerank | betweenness_centrality | |
|---|---|---|---|---|---|
| 0 | 0 | Mr. Hi | 16 | 0.088508 | 0.437635 |
| 1 | 1 | Mr. Hi | 9 | 0.057415 | 0.053937 |
| 2 | 2 | Mr. Hi | 10 | 0.062767 | 0.143657 |
| 3 | 3 | Mr. Hi | 6 | 0.037212 | 0.011909 |
| 4 | 4 | Mr. Hi | 3 | 0.020504 | 0.000631 |
The new edge metric gets added to the edge data as well.
[16]:
hp_existing.edges.data.head()
[16]:
| from | to | weight | edge_load_centrality | |
|---|---|---|---|---|
| 0 | 0 | 1 | 4 | 57.500000 |
| 1 | 0 | 2 | 5 | 150.416667 |
| 2 | 0 | 3 | 3 | 48.000000 |
| 3 | 0 | 4 | 3 | 79.000000 |
| 4 | 0 | 5 | 3 | 130.000000 |
Resolving Column Name Collisions#
If a metric’s column name would collide with a column already in the node / edge data, a ValueError is raised. The fix is to pass node_graph_metric_rename (or edge_graph_metric_rename for edge metrics) to choose a non-colliding name.
Below, we generate a hive plot with a node degree column and then attempt to add another degree column, triggering an error:
[17]:
hp_with_degree = HivePlot(
    graph=G,
    partition_variable="club",
    sorting_variables="degree",
    node_graph_metrics="degree",
)
[18]:
hp_with_degree.nodes.data.head()
[18]:
| unique_id | club | degree | |
|---|---|---|---|
| 0 | 0 | Mr. Hi | 16 |
| 1 | 1 | Mr. Hi | 9 |
| 2 | 2 | Mr. Hi | 10 |
| 3 | 3 | Mr. Hi | 6 |
| 4 | 4 | Mr. Hi | 3 |
[19]:
import traceback

try:
    hp_with_degree.compute_graph_metrics(node_graph_metrics="degree")
except ValueError:
    traceback.print_exc()
Traceback (most recent call last):
  File "/tmp/ipykernel_1890079/1357425335.py", line 4, in <module>
    hp_with_degree.compute_graph_metrics(node_graph_metrics="degree")
  File "/home/garyk/repos/hiveplotlib/src/hiveplotlib/hiveplot.py", line 2609, in compute_graph_metrics
    self._apply_graph_metrics(
  File "/home/garyk/repos/hiveplotlib/src/hiveplotlib/hiveplot.py", line 2478, in _apply_graph_metrics
    new_nodes, new_edges = compute_graph_metrics(
                           ^^^^^^^^^^^^^^^^^^^^^^
  File "/home/garyk/repos/hiveplotlib/src/hiveplotlib/graph_features/__init__.py", line 757, in compute_graph_metrics
    raise ValueError(msg)
ValueError: Cannot attach metric 'degree' under column 'degree': this column is already present on the target NodeCollection or was already used by an earlier metric in this call. Pass `node_metric_rename={'degree': '<new_column_name>'}` (or the matching `node_graph_metric_rename` kwarg on HivePlot) to choose a non-colliding name.
We can pass node_graph_metric_rename to choose a non-colliding name for the new column:
[20]:
hp_with_degree.compute_graph_metrics(
    node_graph_metrics="degree",
    node_graph_metric_rename={"degree": "degree_recomputed"},
)
hp_with_degree.nodes.data[["unique_id", "degree", "degree_recomputed"]].head()
[20]:
| unique_id | degree | degree_recomputed | |
|---|---|---|---|
| 0 | 0 | 16 | 16 |
| 1 | 1 | 9 | 9 |
| 2 | 2 | 10 | 10 |
| 3 | 3 | 6 | 6 |
| 4 | 4 | 3 | 3 |
Controlling the HivePlot Internal Graph Type#
When graph metrics are requested, the HivePlot class builds an internal networkx graph from its nodes and edges and computes the requested graph metrics on the resulting graph.
The graph_directed and graph_multigraph parameters control the type of that internal graph, with defaults depending on whether we build our hive plot from the nodes and edges parameters or from a networkx graph passed via the graph parameter.
When we build from nodes and edges without setting graph_directed, the class also infers the directedness from the requested metrics whenever that request is unambiguous, so a metric like triangles that needs an undirected graph works out of the box. The one rule to keep in mind: directedness can be inferred this way, but multigraph-ness never is. graph_multigraph is only ever what we set explicitly, or, when left unset, the construction default (False from nodes
and edges) or the input graph’s own type when we build from graph. The rest of this section walks through how that inference behaves on each initialization path and the precise ways a graph-type mismatch will stop computation.
When Initializing from nodes and edges Parameters#
When we initialize a HivePlot with nodes and edges (instead of the graph parameter), graph_multigraph defaults to False, and graph_directed is left unset so the class can infer it from the requested metrics, falling back to True (matching the (from, to) semantics of the Edges class) when the request implies no particular directedness.
Some metrics require a specific graph type. For example:
in_degreeandout_degreerequire a directed graph (graph_directed=True).trianglesrequires an undirected graph (graph_directed=False).eigenvector_centrality,clustering, andcore_numberrequire a simple (non-multi) graph (graph_multigraph=False).
Below, a hive plot built from nodes and edges computes triangles with no graph_directed set. When the request leaves graph_directed unset and every requested metric agrees on a directedness, the class infers the satisfying value and builds the matching graph:
[21]:
# no graph_directed set: the class infers undirected for triangles
hp_internal_graph = example_hive_plot(
    num_edges=500,
    drop_duplicate_edges=True,
)
hp_internal_graph.compute_graph_metrics(
    node_graph_metrics="triangles",
)
hp_internal_graph.nodes.data.head()
[21]:
| unique_id | low | med | high | partition_0 | triangles | |
|---|---|---|---|---|---|---|
| 0 | 0 | 6.363247 | 14.795079 | 23.193620 | B | 2 |
| 1 | 1 | 2.695169 | 12.321405 | 21.873202 | A | 2 |
| 2 | 2 | 0.409326 | 18.010787 | 26.718541 | A | 2 |
| 3 | 3 | 0.165111 | 19.226066 | 21.949123 | A | 1 |
| 4 | 4 | 8.124570 | 12.658641 | 25.771102 | C | 5 |
Inference of graph directedness only happens when graph_directed is left unset in both HivePlot initialization and in any downstream HivePlot.compute_graph_metrics() method calls.
Setting the graph_directed parameter puts the graph type under our control. If we then request a metric that needs the opposite type, we will get a ValueError. For example, pinning graph_directed=True and requesting triangles errors:
[22]:
import traceback

# pin graph_directed=True, which blocks inference
try:
    example_hive_plot(
        num_edges=500,
        drop_duplicate_edges=True,
        graph_directed=True,  # triangles needs undirected, so this raises
    ).compute_graph_metrics(node_graph_metrics="triangles")
except ValueError:
    traceback.print_exc()
Traceback (most recent call last):
  File "/tmp/ipykernel_1890079/1670712569.py", line 9, in <module>
    ).compute_graph_metrics(node_graph_metrics="triangles")
      ^^^^^^^^^^^^^^^^^^^^^^^^^^^^^^^^^^^^^^^^^^^^^^^^^^^^^
  File "/home/garyk/repos/hiveplotlib/src/hiveplotlib/hiveplot.py", line 2609, in compute_graph_metrics
    self._apply_graph_metrics(
  File "/home/garyk/repos/hiveplotlib/src/hiveplotlib/hiveplot.py", line 2478, in _apply_graph_metrics
    new_nodes, new_edges = compute_graph_metrics(
                           ^^^^^^^^^^^^^^^^^^^^^^
  File "/home/garyk/repos/hiveplotlib/src/hiveplotlib/graph_features/__init__.py", line 761, in compute_graph_metrics
    _run_metric(
  File "/home/garyk/repos/hiveplotlib/src/hiveplotlib/graph_features/__init__.py", line 447, in _run_metric
    return wrapper(graph, **metric_kwargs)
           ^^^^^^^^^^^^^^^^^^^^^^^^^^^^^^^
  File "/home/garyk/repos/hiveplotlib/src/hiveplotlib/graph_features/networkx/_helpers.py", line 128, in wrapper
    _enforce_graph_type(name, requirement, graph)
  File "/home/garyk/repos/hiveplotlib/src/hiveplotlib/graph_features/networkx/_helpers.py", line 83, in _enforce_graph_type
    raise ValueError(msg)
ValueError: `triangles` does not support directed graphs (nx.DiGraph or nx.MultiDiGraph). Build the source graph as undirected: pass `graph_directed=False` on `HivePlot` / `HivePlotMatrix` initialization, or `directed=False` on `nodes_edges_to_networkx`.
We can still choose to explicitly supply the correct type of graph when we request a graph metric. If we pin the value when initializing a hive plot, then the pinned value also carries through as the default for any later HivePlot.compute_graph_metrics() calls:
[23]:
hp_internal_graph_undirected = example_hive_plot(
    num_edges=500,
    drop_duplicate_edges=True,
    graph_directed=False,  # pin undirected
)

# uses the pinned graph_directed=False
hp_internal_graph_undirected.compute_graph_metrics(
    node_graph_metrics="triangles",
)
hp_internal_graph_undirected.nodes.data.head()
[23]:
| unique_id | low | med | high | partition_0 | triangles | |
|---|---|---|---|---|---|---|
| 0 | 0 | 6.363247 | 14.795079 | 23.193620 | B | 2 |
| 1 | 1 | 2.695169 | 12.321405 | 21.873202 | A | 2 |
| 2 | 2 | 0.409326 | 18.010787 | 26.718541 | A | 2 |
| 3 | 3 | 0.165111 | 19.226066 | 21.949123 | A | 1 |
| 4 | 4 | 8.124570 | 12.658641 | 25.771102 | C | 5 |
A separate failure mode happens when two requested metrics need opposite graph types and cannot share one internal graph; we cover this in the “When Requested Metrics Disagree” subsection below.
When Initializing from graph Parameter#
When we pass a networkx graph via the graph parameter (instead of the nodes and edges parameters), HivePlot initialization defaults to setting graph_directed and graph_multigraph to match the input graph’s type.
This means that an undirected-only metric like triangles works by default only when the input graph is itself undirected. Going back to our undirected Karate Club example, triangles will thus compute without setting graph_directed:
[24]:
# Karate Club is undirected, so graph_directed defaults to False
hp_undirected_default = HivePlot(
    graph=G,
    partition_variable="club",
    sorting_variables="degree",
    node_graph_metrics="degree",
)

# triangles works because the input graph is already undirected
hp_undirected_default.compute_graph_metrics(
    node_graph_metrics="triangles",
)

hp_undirected_default.nodes.data.head()
[24]:
| unique_id | club | degree | triangles | |
|---|---|---|---|---|
| 0 | 0 | Mr. Hi | 16 | 18 |
| 1 | 1 | Mr. Hi | 9 | 12 |
| 2 | 2 | Mr. Hi | 10 | 11 |
| 3 | 3 | Mr. Hi | 6 | 10 |
| 4 | 4 | Mr. Hi | 3 | 2 |
If we instead pass a directed graph and the same undirected-only metric triangles, then the default parameters will raise a ValueError:
[25]:
import traceback

# a directed input graph pins the internal graph to directed
G_directed = nx.DiGraph(nx.karate_club_graph())
hp_directed = HivePlot(
    graph=G_directed,
    partition_variable="club",
    sorting_variables="degree",
    node_graph_metrics="degree",
)

# triangles needs undirected; the directed internal graph raises
try:
    hp_directed.compute_graph_metrics(node_graph_metrics="triangles")
except ValueError:
    traceback.print_exc()
Traceback (most recent call last):
  File "/tmp/ipykernel_1890079/147643961.py", line 14, in <module>
    hp_directed.compute_graph_metrics(node_graph_metrics="triangles")
  File "/home/garyk/repos/hiveplotlib/src/hiveplotlib/hiveplot.py", line 2609, in compute_graph_metrics
    self._apply_graph_metrics(
  File "/home/garyk/repos/hiveplotlib/src/hiveplotlib/hiveplot.py", line 2478, in _apply_graph_metrics
    new_nodes, new_edges = compute_graph_metrics(
                           ^^^^^^^^^^^^^^^^^^^^^^
  File "/home/garyk/repos/hiveplotlib/src/hiveplotlib/graph_features/__init__.py", line 761, in compute_graph_metrics
    _run_metric(
  File "/home/garyk/repos/hiveplotlib/src/hiveplotlib/graph_features/__init__.py", line 447, in _run_metric
    return wrapper(graph, **metric_kwargs)
           ^^^^^^^^^^^^^^^^^^^^^^^^^^^^^^^
  File "/home/garyk/repos/hiveplotlib/src/hiveplotlib/graph_features/networkx/_helpers.py", line 128, in wrapper
    _enforce_graph_type(name, requirement, graph)
  File "/home/garyk/repos/hiveplotlib/src/hiveplotlib/graph_features/networkx/_helpers.py", line 83, in _enforce_graph_type
    raise ValueError(msg)
ValueError: `triangles` does not support directed graphs (nx.DiGraph or nx.MultiDiGraph). Build the source graph as undirected: pass `graph_directed=False` on `HivePlot` / `HivePlotMatrix` initialization, or `directed=False` on `nodes_edges_to_networkx`.
We can still override these defaults if desired though, either when calling the compute_graph_metrics() method or on initialization of HivePlot. For example, overriding the undirected Karate Club input with HivePlot(..., graph_directed=True) raises the same error above when computing the undirected triangles metric, but calling compute_graph_metrics(..., graph_directed=False) allows us to still compute the undirected metric:
[26]:
import traceback

# force the undirected input to directed
hp_forced_directed = HivePlot(
    graph=G,
    partition_variable="club",
    sorting_variables="degree",
    node_graph_metrics="degree",
    graph_directed=True,
)

# triangles fails because we pinned the internal graph to directed
try:
    hp_forced_directed.compute_graph_metrics(
        node_graph_metrics="triangles",
    )
except ValueError:
    traceback.print_exc()
Traceback (most recent call last):
  File "/tmp/ipykernel_1890079/1850748602.py", line 14, in <module>
    hp_forced_directed.compute_graph_metrics(
  File "/home/garyk/repos/hiveplotlib/src/hiveplotlib/hiveplot.py", line 2609, in compute_graph_metrics
    self._apply_graph_metrics(
  File "/home/garyk/repos/hiveplotlib/src/hiveplotlib/hiveplot.py", line 2478, in _apply_graph_metrics
    new_nodes, new_edges = compute_graph_metrics(
                           ^^^^^^^^^^^^^^^^^^^^^^
  File "/home/garyk/repos/hiveplotlib/src/hiveplotlib/graph_features/__init__.py", line 761, in compute_graph_metrics
    _run_metric(
  File "/home/garyk/repos/hiveplotlib/src/hiveplotlib/graph_features/__init__.py", line 447, in _run_metric
    return wrapper(graph, **metric_kwargs)
           ^^^^^^^^^^^^^^^^^^^^^^^^^^^^^^^
  File "/home/garyk/repos/hiveplotlib/src/hiveplotlib/graph_features/networkx/_helpers.py", line 128, in wrapper
    _enforce_graph_type(name, requirement, graph)
  File "/home/garyk/repos/hiveplotlib/src/hiveplotlib/graph_features/networkx/_helpers.py", line 83, in _enforce_graph_type
    raise ValueError(msg)
ValueError: `triangles` does not support directed graphs (nx.DiGraph or nx.MultiDiGraph). Build the source graph as undirected: pass `graph_directed=False` on `HivePlot` / `HivePlotMatrix` initialization, or `directed=False` on `nodes_edges_to_networkx`.
[27]:
# a per-call graph_directed=False overrides back to undirected
hp_forced_directed.compute_graph_metrics(
    node_graph_metrics="triangles",
    graph_directed=False,
)

hp_forced_directed.nodes.data.head()
[27]:
| unique_id | club | degree | triangles | |
|---|---|---|---|---|
| 0 | 0 | Mr. Hi | 16 | 18 |
| 1 | 1 | Mr. Hi | 9 | 12 |
| 2 | 2 | Mr. Hi | 10 | 11 |
| 3 | 3 | Mr. Hi | 6 | 10 |
| 4 | 4 | Mr. Hi | 3 | 2 |
As with the nodes and edges hive plot initialization, requesting two metrics that need opposite graph types is a separate failure mode, covered in the next section.
When Requested Metrics Disagree#
The breaks above are all one metric meeting the wrong graph type. A different problem arises when a set of requested metrics cannot share one internal graph because they need opposite graph types. This situation raises a single ValueError before computing anything, rather than computing one metric and failing on the next.
For example, in_degree needs a directed graph and triangles needs an undirected one. Requesting both in one call raises an error that names both metrics, states they cannot share one internal graph, and gives the two-call fix:
[28]:
import traceback

# in_degree needs directed, triangles needs undirected: no graph fits both
try:
    HivePlot(
        graph=G,
        partition_variable="club",
        sorting_variables="club",
        node_graph_metrics=["in_degree", "triangles"],
        graph_directed=True,
    )
except ValueError:
    traceback.print_exc()
Traceback (most recent call last):
  File "/tmp/ipykernel_1890079/1156824259.py", line 5, in <module>
    HivePlot(
  File "/home/garyk/repos/hiveplotlib/src/hiveplotlib/hiveplot.py", line 2264, in __init__
    self._apply_graph_metrics(
  File "/home/garyk/repos/hiveplotlib/src/hiveplotlib/hiveplot.py", line 2478, in _apply_graph_metrics
    new_nodes, new_edges = compute_graph_metrics(
                           ^^^^^^^^^^^^^^^^^^^^^^
  File "/home/garyk/repos/hiveplotlib/src/hiveplotlib/graph_features/__init__.py", line 704, in compute_graph_metrics
    _check_graph_type_conflicts(
  File "/home/garyk/repos/hiveplotlib/src/hiveplotlib/graph_features/__init__.py", line 294, in _check_graph_type_conflicts
    raise ValueError(head + resolution)
ValueError: Conflicting graph-type requirements: `in_degree` requires a directed graph, but `triangles` requires an undirected graph. These cannot share one internal graph in a single call (the internal graph resolved to `directed=True`, which satisfies at most one side). Split this into two calls: set `graph_directed=True` for `in_degree` and `graph_directed=False` for `triangles`, then chain the returned nodes/edges.
The same standoff can span the node/edge boundary. Node metrics and edge metrics run against the one internal graph, so a directed-only node metric and an undirected-only edge metric conflict just as two node metrics would. Here in_degree (a node metric) and bridges (an edge metric) disagree, and the validator catches it by reasoning over the combined node and edge set:
[29]:
try:
    HivePlot(
        graph=G,
        partition_variable="club",
        sorting_variables="club",
        node_graph_metrics="in_degree",
        edge_graph_metrics="bridges",
        graph_directed=True,
    )
except ValueError:
    traceback.print_exc()
Traceback (most recent call last):
  File "/tmp/ipykernel_1890079/412541063.py", line 2, in <module>
    HivePlot(
  File "/home/garyk/repos/hiveplotlib/src/hiveplotlib/hiveplot.py", line 2264, in __init__
    self._apply_graph_metrics(
  File "/home/garyk/repos/hiveplotlib/src/hiveplotlib/hiveplot.py", line 2478, in _apply_graph_metrics
    new_nodes, new_edges = compute_graph_metrics(
                           ^^^^^^^^^^^^^^^^^^^^^^
  File "/home/garyk/repos/hiveplotlib/src/hiveplotlib/graph_features/__init__.py", line 704, in compute_graph_metrics
    _check_graph_type_conflicts(
  File "/home/garyk/repos/hiveplotlib/src/hiveplotlib/graph_features/__init__.py", line 294, in _check_graph_type_conflicts
    raise ValueError(head + resolution)
ValueError: Conflicting graph-type requirements: `in_degree` requires a directed graph, but `bridges` requires an undirected graph. These cannot share one internal graph in a single call (the internal graph resolved to `directed=True`, which satisfies at most one side). Split this into two calls: set `graph_directed=True` for `in_degree` and `graph_directed=False` for `bridges`, then chain the returned nodes/edges.
The fix the error points to is to split the work into two calls, one per graph type, chaining the augmented nodes and edges from the first call into the second. Each call computes the metrics that match its graph type:
[30]:
# first call: the directed metric on a directed hive plot
hp_two_call = HivePlot(
    graph=G,
    partition_variable="club",
    sorting_variables="in_degree",
    node_graph_metrics="in_degree",
    graph_directed=True,
)

# second call: the undirected metric, reusing the augmented nodes/edges
hp_two_call.compute_graph_metrics(
    node_graph_metrics="triangles",
    graph_directed=False,
)

# both in_degree and triangles are now columns
hp_two_call.nodes.data.head()
[30]:
| unique_id | club | in_degree | triangles | |
|---|---|---|---|---|
| 0 | 0 | Mr. Hi | 0 | 18 |
| 1 | 1 | Mr. Hi | 1 | 12 |
| 2 | 2 | Mr. Hi | 2 | 11 |
| 3 | 3 | Mr. Hi | 3 | 10 |
| 4 | 4 | Mr. Hi | 1 | 2 |
The multigraph axis works the same way. Some metrics (clustering, eigenvector_centrality, core_number) do not support multigraphs. Requesting one against a multigraph internal graph fails fast and points at graph_multigraph=False:
[31]:
try:
    HivePlot(
        graph=G,
        partition_variable="club",
        sorting_variables="club",
        node_graph_metrics=["degree", "clustering"],
        graph_multigraph=True,
    )
except ValueError:
    traceback.print_exc()
Traceback (most recent call last):
  File "/tmp/ipykernel_1890079/1462981095.py", line 2, in <module>
    HivePlot(
  File "/home/garyk/repos/hiveplotlib/src/hiveplotlib/hiveplot.py", line 2264, in __init__
    self._apply_graph_metrics(
  File "/home/garyk/repos/hiveplotlib/src/hiveplotlib/hiveplot.py", line 2478, in _apply_graph_metrics
    new_nodes, new_edges = compute_graph_metrics(
                           ^^^^^^^^^^^^^^^^^^^^^^
  File "/home/garyk/repos/hiveplotlib/src/hiveplotlib/graph_features/__init__.py", line 704, in compute_graph_metrics
    _check_graph_type_conflicts(
  File "/home/garyk/repos/hiveplotlib/src/hiveplotlib/graph_features/__init__.py", line 314, in _check_graph_type_conflicts
    raise ValueError(msg)
ValueError: Conflicting graph-type requirements: `clustering` does not support multigraphs, but the internal graph is a multigraph. Rebuild the source graph as `graph_multigraph=False` to compute this metric.
Parallel Edges and the Collapse Warning#
When the edge data holds same-direction duplicate (from, to) rows, building an underlying graph with graph_multigraph=False merges each set of duplicates into a single edge, keeping only the last duplicate’s attributes (weights, types, and so on) and dropping the rest before the metric runs. Hiveplotlib emits a UserWarning so this silent loss is visible.
The example_hive_plot() calls earlier in this section passed drop_duplicate_edges=True precisely to sidestep this. Without it, the randomly generated edge set keeps its duplicates, and requesting a metric triggers the warning:
[32]:
# without drop_duplicate_edges, the random edge set keeps its duplicate (from, to) rows
hp_duplicates = example_hive_plot(num_edges=500)
hp_duplicates.compute_graph_metrics(node_graph_metrics="degree")
/tmp/ipykernel_1890079/776289985.py:3: UserWarning: 9 duplicate `(from, to)` edges will be merged into single edges for metric computation because `graph_multigraph=False`. networkx keeps only the last duplicate's edge attributes (weights, types, etc.); the others are dropped before the metric runs. Pass `graph_multigraph=True` to keep parallel edges distinct.
  hp_duplicates.compute_graph_metrics(node_graph_metrics="degree")
There are three ways to respond:
Pass
graph_multigraph=Trueto keep the parallel edges distinct, for any metric that accepts a multigraph.Remove the duplicates from the data before building, for example with
drop_duplicate_edges=Trueonexample_hive_plot()or by deduplicating your ownEdges.Pass
warn_on_parallel_edge_collapse=Falseto silence the warning. This is a performance escape hatch for large graphs; it does not change the merge (the duplicates still collapse).
A related merge happens without a warning: reciprocal (a, b) / (b, a) rows on an undirected build. An undirected graph treats the pair as one symmetric edge, so the two rows collapse into a single edge that keeps only the surviving row’s attributes. Choosing an undirected build is itself the statement that the pair is symmetric, so this is the intended meaning rather than accidental loss, and no warning fires. If both directions carry distinct attributes you care about (a differing
weight, for example), make sure to pre-aggregate them into one row before building.
Below, two reciprocal rows carry different weights, and computing degree on an undirected graph merges them into a single edge with no warning:
[33]:
import pandas as pd
from hiveplotlib import Edges, NodeCollection

reciprocal_nodes = NodeCollection(
    data=pd.DataFrame(
        {
            "unique_id": [0, 1, 2, 3],
            "club": ["A", "A", "B", "B"],
            "rank": [1, 2, 1, 2],
        }
    ),
    unique_id_column="unique_id",
)

# (0, 2) and (2, 0) are reciprocal rows carrying different weights
reciprocal_edges = Edges(
    data=pd.DataFrame(
        {
            "from": [0, 2, 1],
            "to": [2, 0, 3],
            "weight": [10.0, 99.0, 1.0],
        }
    ),
)

hp_reciprocal = HivePlot(
    nodes=reciprocal_nodes,
    edges=reciprocal_edges,
    partition_variable="club",
    sorting_variables="rank",
    graph_directed=False,  # (0, 2) and (2, 0) merge into one undirected edge
)

# no warning fires, even though the reciprocal pair merged into a single edge
hp_reciprocal.compute_graph_metrics(node_graph_metrics="degree")
hp_reciprocal.nodes.data.head()
[33]:
| unique_id | club | rank | degree | |
|---|---|---|---|---|
| 0 | 0 | A | 1 | 1 |
| 1 | 1 | A | 2 | 1 |
| 2 | 2 | B | 1 | 1 |
| 3 | 3 | B | 2 | 1 |
For more on routing graph metric computation through accelerated networkx backends, see the Graph Metric Backends page.
For more on building a HivePlot from a networkx graph, see the Creating Hive Plots from NetworkX page.
For more on exporting a hive plot back to networkx, see the Exporting Hive Plots to NetworkX page.
HivePlotMatrix exposes the same graph_directed and graph_multigraph controls, and the conflict and multigraph rules carry over unchanged. Directedness inference, however, differs slightly: from_partition and from_variable_sweep infer it from the requested metrics, while the generic constructor and from_tags ignore the metrics and build the directedness set by their graph_directed argument. See the HivePlotMatrix docstrings for the per-constructor details.