

Creating Hive Plots from NetworkX#
This notebook discusses how to create hive plots from a networkx.Graph instance.
Note: this notebook requires that Hiveplotlib be installed with extra packages, which can be done by running:
pip install hiveplotlib[networkx]
[1]:
import networkx as nx
from hiveplotlib import HivePlot
We will base this discussion on the Zachary’s Karate Club graph available in networkx. For more information about this example network, see our Zachary’s Karate Club tutorial.
[2]:
G = nx.karate_club_graph()
Building the Hive Plot#
The most direct way to construct a HivePlot from a networkx graph is to pass it via the graph parameter to HivePlot(). This is the easiest entry point when we don’t need to inspect or modify the nodes and edges that will be created before constructing the hive plot.
In addition to the networkx graph, we need only supply:
A node partition variable (a column on the underlying node data. For the karate club graph, the built-in
clubcolumn is a natural fit).A node sorting variable per axis (for this example, we’ll use node degree).
We don’t have node degree on the input graph, but we can request it as a graph metric on hive plot initialization via the node_graph_metrics parameter. For more on Hiveplotlib-supported graph metrics, see the Computing Graph Metrics page.
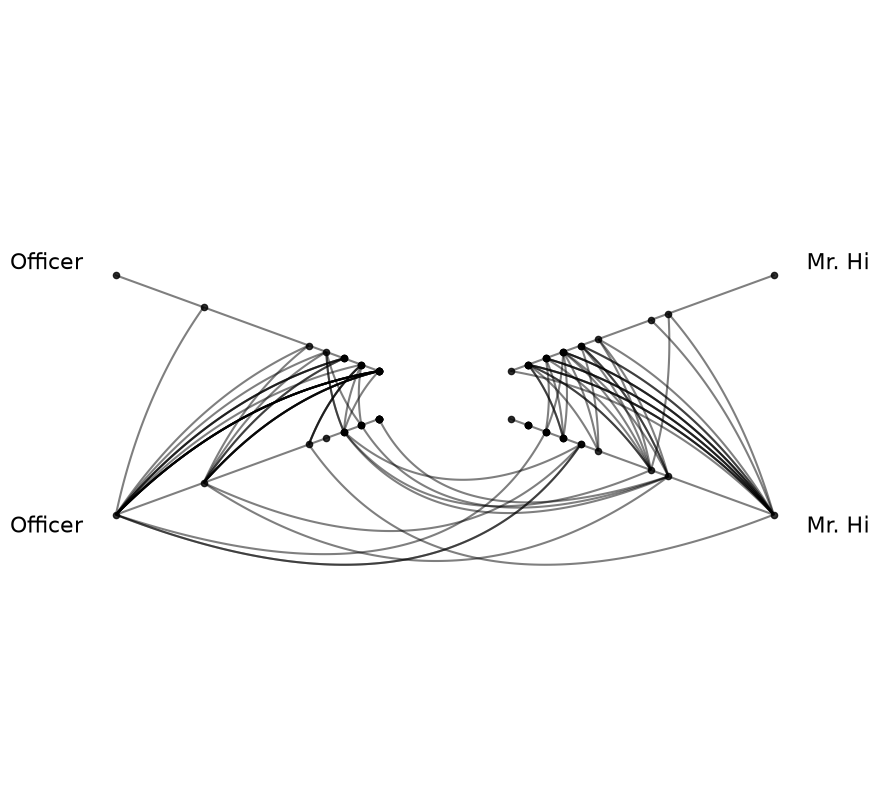
We will also make two specific changes from the defaults for this hive plot:
Since we only have two partition groups, we will manually remove one set of inter-group edges since the two sets of inter-group edges are identical.
Since intra-group behavior is of interest with the Zachary’s Karate Club network, we will set
repeat_axes=True.
[3]:
hp = HivePlot(
    graph=G,  # takes a networkx graph, no nodes / edges necessary
    partition_variable="club",
    sorting_variables="degree",  # sort axes on the to-be-computed `degree` metric
    node_graph_metrics="degree",  # compute degree on the internal graph
    repeat_axes=True,
)

# only 2 unique partition values, so we'll kill one set of inter-axis edges
#  since they're redundant
hp.reset_edges(axis_id_1="Mr. Hi_repeat", axis_id_2="Officer")

hp.plot();
Inspecting the Underlying NodeCollection and Edges#
After construction, hp.nodes and hp.edges give access to the underlying data structures. The requested degree metric is now a column on hp.nodes.data:
[4]:
hp.nodes.data.head()
[4]:
| unique_id | club | degree | |
|---|---|---|---|
| 0 | 0 | Mr. Hi | 16 |
| 1 | 1 | Mr. Hi | 9 |
| 2 | 2 | Mr. Hi | 10 |
| 3 | 3 | Mr. Hi | 6 |
| 4 | 4 | Mr. Hi | 3 |
[5]:
hp.edges.data.head()
[5]:
| from | to | weight | |
|---|---|---|---|
| 0 | 0 | 1 | 4 |
| 1 | 0 | 2 | 5 |
| 2 | 0 | 3 | 3 |
| 3 | 0 | 4 | 3 |
| 4 | 0 | 5 | 3 |
Working with the Intermediate NodeCollection and Edges#
In some cases, we may want to inspect or modify the data structures before constructing the hive plot. For example, we may want to create a new partition variable to use as our HivePlot partition variable.
In these cases, we can use the lower-level networkx_to_nodes_edges() function to first perform the conversion to NodeCollection and Edges instances. Then, we can pass the resulting nodes and edges to HivePlot() directly:
[6]:
from hiveplotlib.converters import networkx_to_nodes_edges

nodes, edges = networkx_to_nodes_edges(graph=G)
[7]:
nodes.data.head()
[7]:
| unique_id | club | |
|---|---|---|
| 0 | 0 | Mr. Hi |
| 1 | 1 | Mr. Hi |
| 2 | 2 | Mr. Hi |
| 3 | 3 | Mr. Hi |
| 4 | 4 | Mr. Hi |
[8]:
edges.data.head()
[8]:
| from | to | weight | |
|---|---|---|---|
| 0 | 0 | 1 | 4 |
| 1 | 0 | 2 | 5 |
| 2 | 0 | 3 | 3 |
| 3 | 0 | 4 | 3 |
| 4 | 0 | 5 | 3 |
Once we have the node and edge data structures, we can build the equivalent hive plot by passing them to HivePlot() along with the same parameters used above:
[9]:
hp = HivePlot(
    nodes=nodes,
    edges=edges,
    partition_variable="club",
    sorting_variables="degree",
    node_graph_metrics="degree",
    repeat_axes=True,
)

hp.reset_edges(axis_id_1="Mr. Hi_repeat", axis_id_2="Officer")

hp.plot();

For more on choosing partition variables, see the Setting a Partition Variable page.
For more on choosing axis sorting variables, see the Setting Axis Sorting Variables page.
For exporting a HivePlot back to a networkx graph, see the Exporting Hive Plots to NetworkX page.