

Adding and Modifying Repeat Axes#
Hive plots allow us to intuitively explore the interaction of groups in a partition of the nodes in a network, but how do we explore the relationships within a partition group?
We solve this with repeat axes. By providing a repeat axis next to its original axis, we can draw intra-group edges while still preserving all our inter-group edges.
When instantiating a new HivePlot object, users can provide the repeat_axes parameter to set one / multiple / all of the axes to include a repeat axis.
Users can also modify the included repeat axes for an existing HivePlot by calling the HivePlot.set_repeat_axes() method.
This notebook demonstrates these two ways of setting / modifying the repeat axes with the HivePlot class.
[1]:
import matplotlib.pyplot as plt
from flexitext import flexitext
from hiveplotlib.datasets import example_hive_plot
[2]:
# keep intra group edge colors consistent throughout notebook
INTRA_EDGE_COLORS = {
    "A": "red",
    "B": "blue",
    "C": "gold",
}
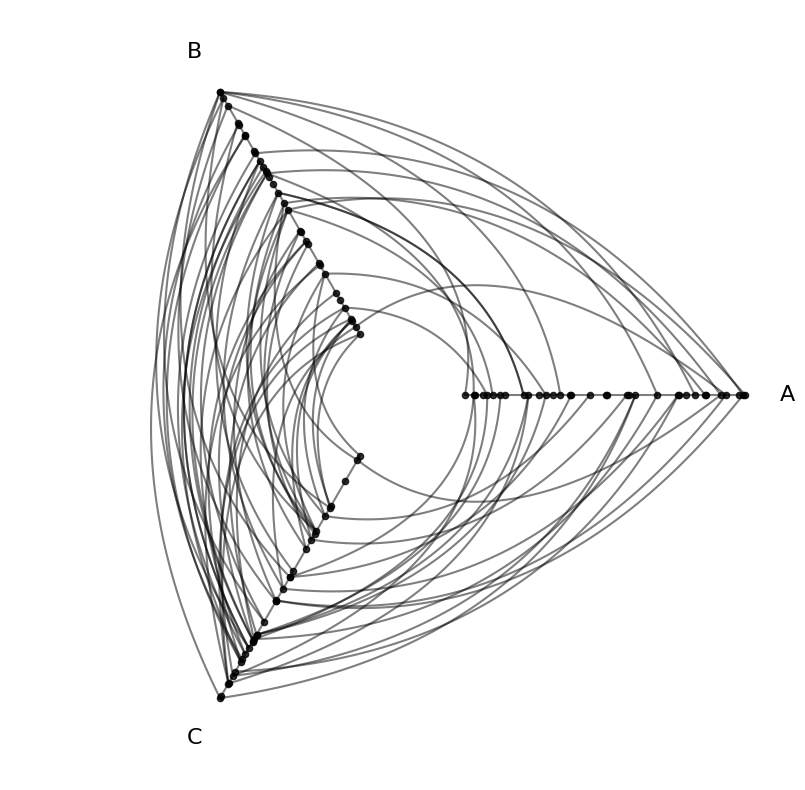
We will base this discussion on the following toy hive plot:
[3]:
hp = example_hive_plot()

hp.plot();
Set Repeat Axes on a New Hive Plot#
By default, we are only looking at inter-group connections, as HivePlot objects instantiate by default with repeat_axes=False, which excludes any repeat axes, but this example also has intra-group edges.
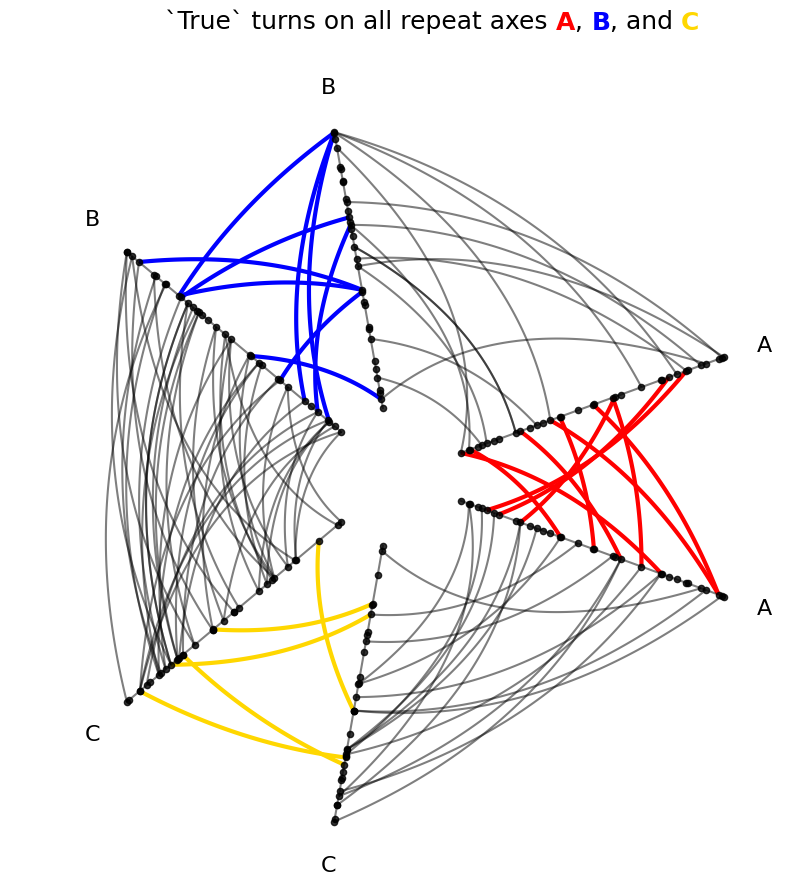
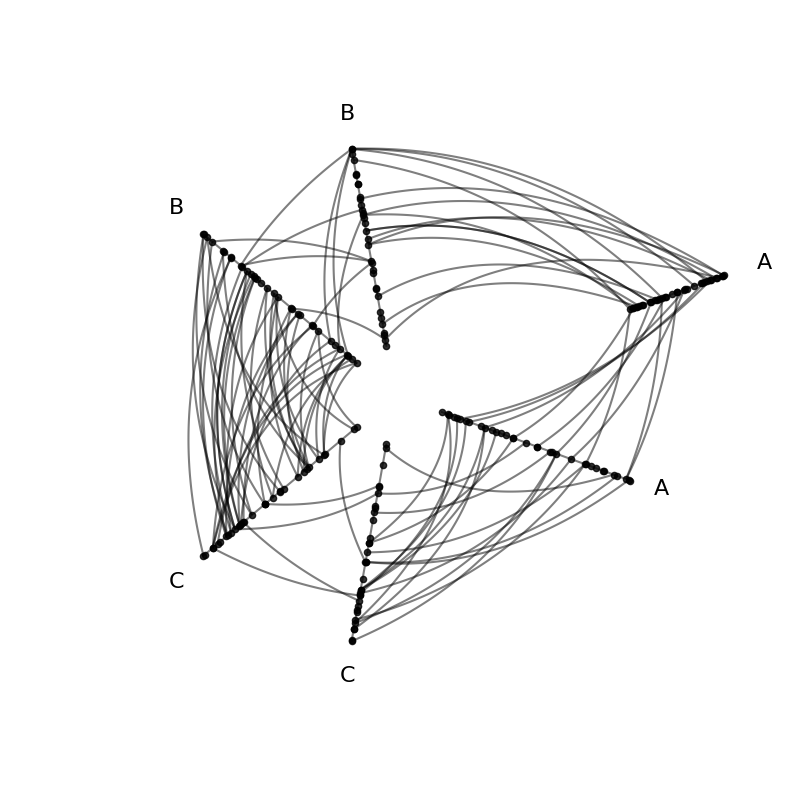
Set All Repeat Axes on a New Hive Plot#
To include all repeat axes, we can set repeat_axes=True. Note that the example_hive_plot() call accepts this keyword argument below and passes it to the instantiation of the HivePlot object.
[4]:
hp_repeat_axes = example_hive_plot(
    repeat_axes=True,  # passes to HivePlot() instantiation
)

for axis in INTRA_EDGE_COLORS:
    hp_repeat_axes.update_edges(
        partition_id_1=axis,
        partition_id_2=axis,
        color=INTRA_EDGE_COLORS[axis],
        linewidth=3,
        alpha=1,
    )

fig, ax = hp_repeat_axes.plot()

# embed legend in the title
flexitext(
    x=0.55,
    y=0.95,
    s="<size:18>`True` turns on all repeat axes "
    f"<color:{INTRA_EDGE_COLORS['A']}, weight:bold>A</>, "
    f"<color:{INTRA_EDGE_COLORS['B']}, weight:bold>B</>, and "
    f"<color:{INTRA_EDGE_COLORS['C']}, weight:bold>C</>"
    "</>",
    xycoords="figure fraction",
    ha="center",
)
plt.show()
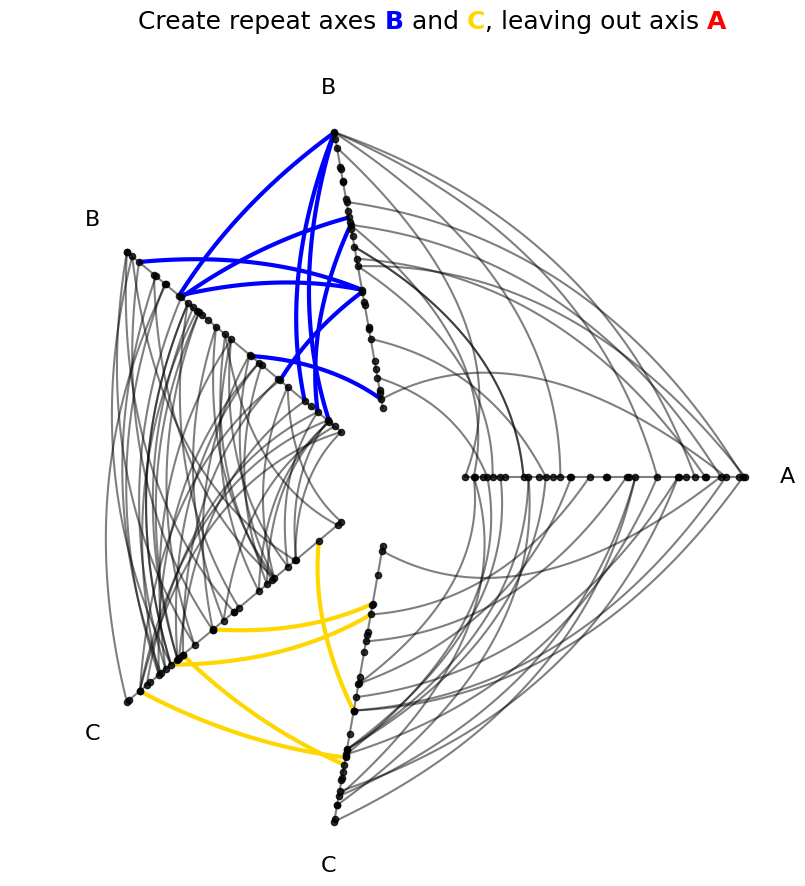
Set a Subset of Repeat Axes on a New Hive Plot#
To include a subset of the possible repeat axes in our hive plot, we can set repeat_axes=[<axis name 1>, <axis name 2>, ...]. Note that the example_hive_plot() call accepts this keyword argument below and passes it to the instantiation of the HivePlot object.
[5]:
repeat_axes = ["B", "C"]
hp_repeat_axes = example_hive_plot(
    repeat_axes=repeat_axes,  # passes to HivePlot() instantiation
)

for axis in repeat_axes:
    hp_repeat_axes.update_edges(
        partition_id_1=axis,
        partition_id_2=axis,
        color=INTRA_EDGE_COLORS[axis],
        linewidth=3,
        alpha=1,
    )

fig, ax = hp_repeat_axes.plot()

# embed legend in the title
flexitext(
    x=0.55,
    y=0.95,
    s="<size:18>Create repeat axes "
    f"<color:{INTRA_EDGE_COLORS['B']}, weight:bold>B</> and "
    f"<color:{INTRA_EDGE_COLORS['C']}, weight:bold>C</>, leaving out axis "
    f"<color:{INTRA_EDGE_COLORS['A']}, weight:bold>A</>"
    "</>",
    xycoords="figure fraction",
    ha="center",
)

plt.show()
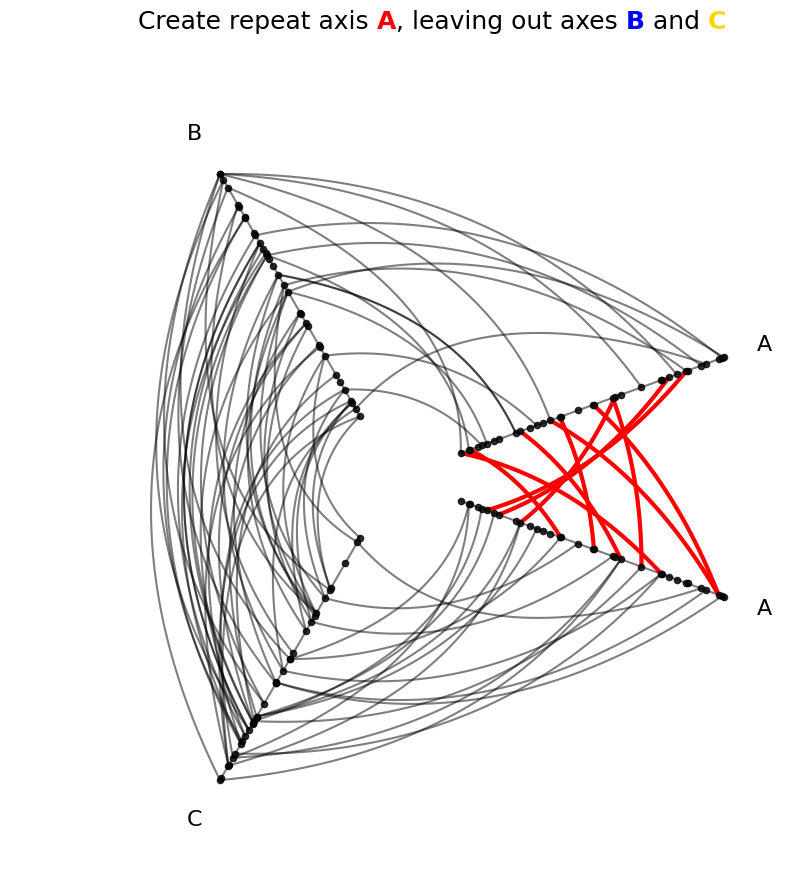
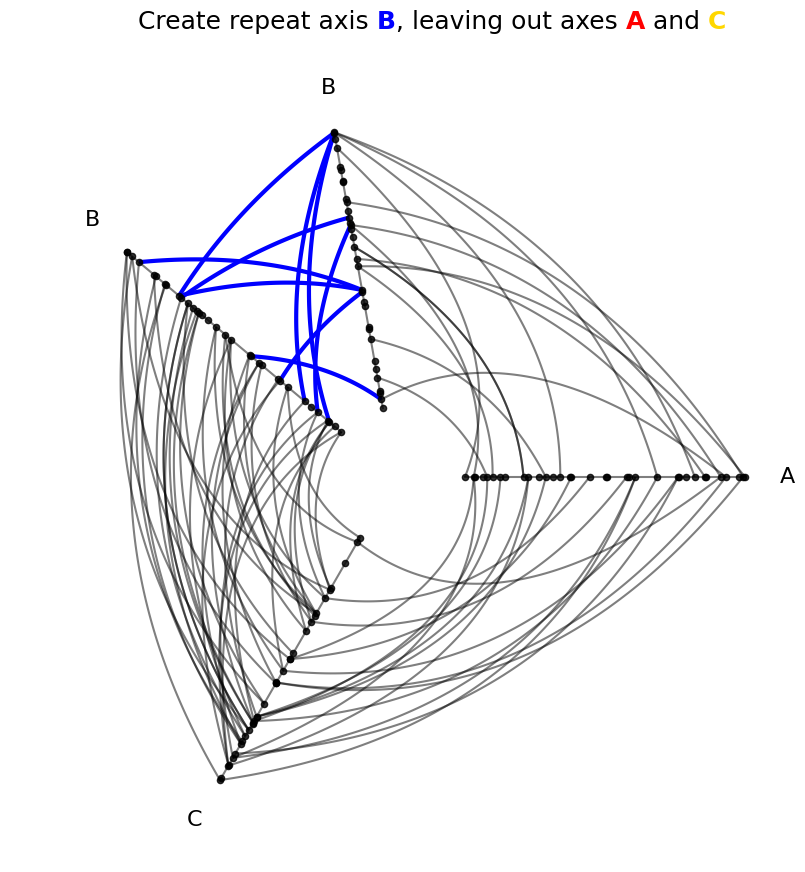
We can also specify a single repeat axis with just a single axis name:
[6]:
repeat_axes = "A"
hp_repeat_axes = example_hive_plot(
    repeat_axes=repeat_axes,  # passes to HivePlot() instantiation
)

for axis in list(repeat_axes):
    hp_repeat_axes.update_edges(
        partition_id_1=axis,
        partition_id_2=axis,
        color=INTRA_EDGE_COLORS[axis],
        linewidth=3,
        alpha=1,
    )

fig, ax = hp_repeat_axes.plot()

# embed legend in the title
flexitext(
    x=0.55,
    y=0.95,
    s="<size:18>Create repeat axis "
    f"<color:{INTRA_EDGE_COLORS['A']}, weight:bold>A</>, leaving out axes "
    f"<color:{INTRA_EDGE_COLORS['B']}, weight:bold>B</> and "
    f"<color:{INTRA_EDGE_COLORS['C']}, weight:bold>C</>"
    "</>",
    xycoords="figure fraction",
    ha="center",
)

plt.show()
Set Repeat Axes on an Existing Hive Plot#
We can modify the visible repeat axes on an existing hive plot using the HivePlot.set_repeat_axes() method.
This method will always overwrite whatever current repeat axes are visible, so make sure to specify each repeat axis you want in your hive plot every time you call this method, even if a repeat axis was already included previously.
We will start with the following initial hive plot for all of the below examples:
[7]:
repeat_axes = "B"
hp_existing = example_hive_plot(
    repeat_axes=repeat_axes,  # passes to HivePlot() instantiation
)

for axis in list(repeat_axes):
    hp_existing.update_edges(
        partition_id_1=axis,
        partition_id_2=axis,
        color=INTRA_EDGE_COLORS[axis],
        linewidth=3,
        alpha=1,
    )

fig, ax = hp_existing.plot()

# embed legend in the title
flexitext(
    x=0.55,
    y=0.95,
    s="<size:18>Create repeat axis "
    f"<color:{INTRA_EDGE_COLORS['B']}, weight:bold>B</>, leaving out axes "
    f"<color:{INTRA_EDGE_COLORS['A']}, weight:bold>A</> and "
    f"<color:{INTRA_EDGE_COLORS['C']}, weight:bold>C</>"
    "</>",
    xycoords="figure fraction",
    ha="center",
)

plt.show()
Set All Repeat Axes on an Existing Hive Plot#
To include all repeat axes, we can run:
HivePlot.set_repeat_axes(True)
This will override whatever initial repeat axes were hidden, showing all repeat axes.
[8]:
hp_existing = example_hive_plot(
    repeat_axes="B",  # passes to HivePlot() instantiation
)

hp_existing.set_repeat_axes(True)  # turns on repeat all axes

for axis in INTRA_EDGE_COLORS:
    hp_existing.update_edges(
        partition_id_1=axis,
        partition_id_2=axis,
        color=INTRA_EDGE_COLORS[axis],
        linewidth=3,
        alpha=1,
    )

fig, ax = hp_existing.plot()

# embed legend in the title
flexitext(
    x=0.55,
    y=0.95,
    s="<size:18>`True` updates to show all repeat axes "
    f"<color:{INTRA_EDGE_COLORS['A']}, weight:bold>A</>, "
    f"<color:{INTRA_EDGE_COLORS['B']}, weight:bold>B</>, and "
    f"<color:{INTRA_EDGE_COLORS['C']}, weight:bold>C</>"
    "</>",
    xycoords="figure fraction",
    ha="center",
)
plt.show()

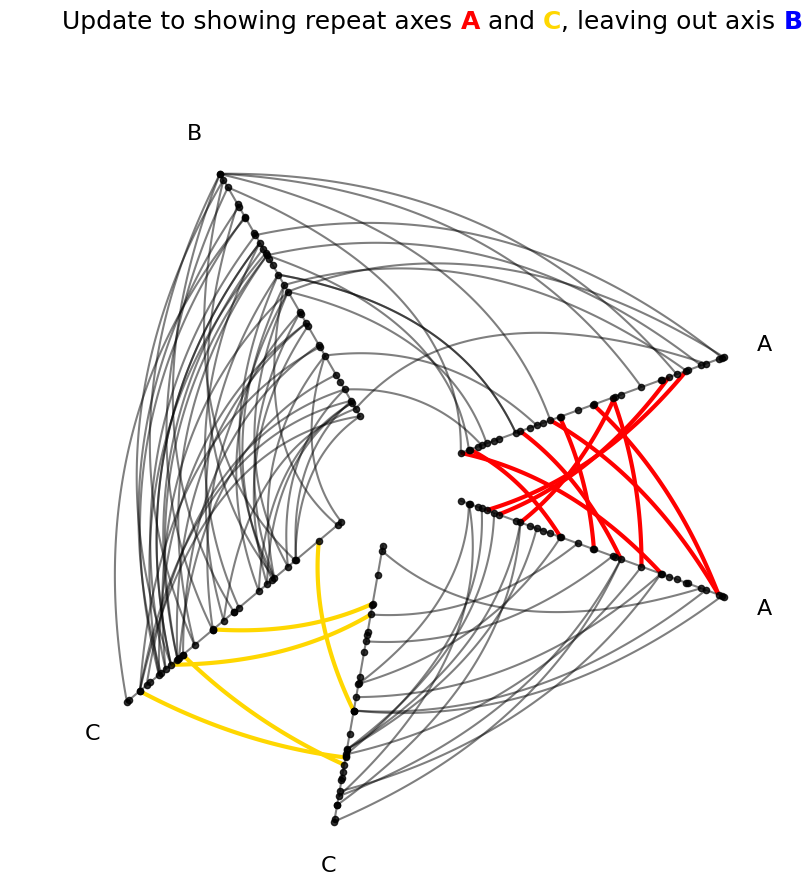
Set Some Repeat Axes on an Existing Hive Plot#
To include a subset of repeat axes, we can run:
HivePlot.set_repeat_axes(axes_names=[<axis name 1>, <axis name 2>, ...])
[9]:
hp_existing = example_hive_plot(
    repeat_axes="B",  # passes to HivePlot() instantiation
)

repeat_axes = ["A", "C"]
hp_existing.set_repeat_axes(
    axes_names=repeat_axes,  # loses B repeat axis!
)

for axis in repeat_axes:
    hp_existing.update_edges(
        partition_id_1=axis,
        partition_id_2=axis,
        color=INTRA_EDGE_COLORS[axis],
        linewidth=3,
        alpha=1,
    )

fig, ax = hp_existing.plot()

# embed legend in the title
flexitext(
    x=0.55,
    y=0.95,
    s="<size:18>Update to showing repeat axes "
    f"<color:{INTRA_EDGE_COLORS['A']}, weight:bold>A</> and "
    f"<color:{INTRA_EDGE_COLORS['C']}, weight:bold>C</>, leaving out axis "
    f"<color:{INTRA_EDGE_COLORS['B']}, weight:bold>B</>"
    "</>",
    xycoords="figure fraction",
    ha="center",
)

plt.show()
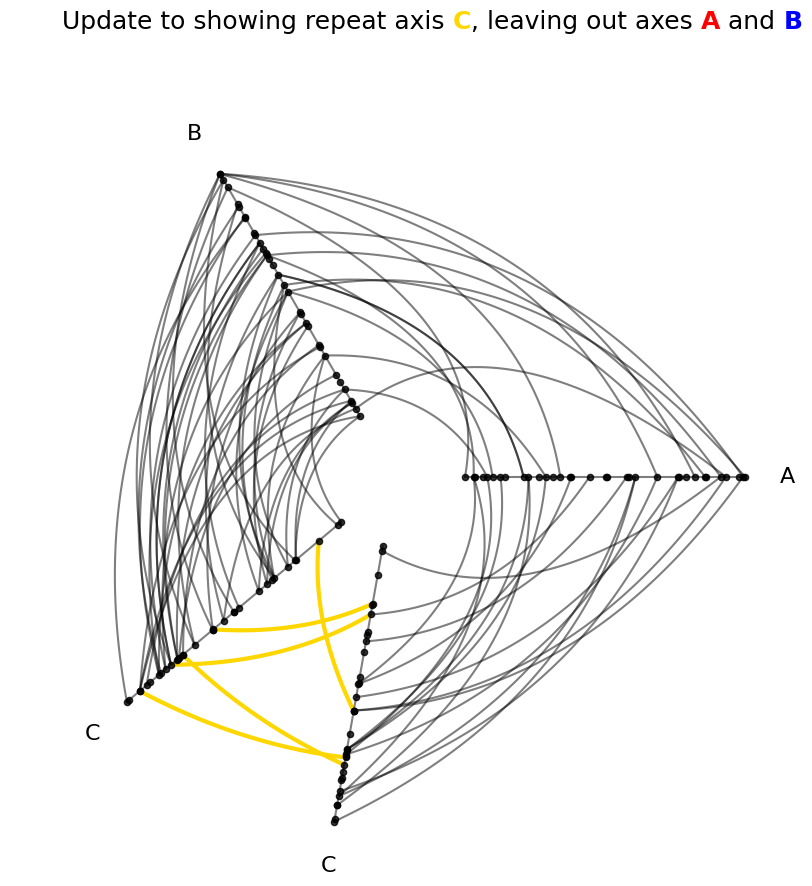
We can also specify a single repeat axis with just a single axis name:
HivePlot.set_repeat_axes(axes_names=<axis name 1>)
[10]:
hp_existing = example_hive_plot(
    repeat_axes="B",  # passes to HivePlot() instantiation
)

repeat_axes = "C"
hp_existing.set_repeat_axes(
    axes_names=repeat_axes,  # loses B repeat axis!
)

for axis in list(repeat_axes):
    hp_existing.update_edges(
        partition_id_1=axis,
        partition_id_2=axis,
        color=INTRA_EDGE_COLORS[axis],
        linewidth=3,
        alpha=1,
    )

fig, ax = hp_existing.plot()

# embed legend in the title
flexitext(
    x=0.55,
    y=0.95,
    s="<size:18>Update to showing repeat axis "
    f"<color:{INTRA_EDGE_COLORS['C']}, weight:bold>C</>, leaving out axes "
    f"<color:{INTRA_EDGE_COLORS['A']}, weight:bold>A</> and "
    f"<color:{INTRA_EDGE_COLORS['B']}, weight:bold>B</>"
    "</>",
    xycoords="figure fraction",
    ha="center",
)

plt.show()
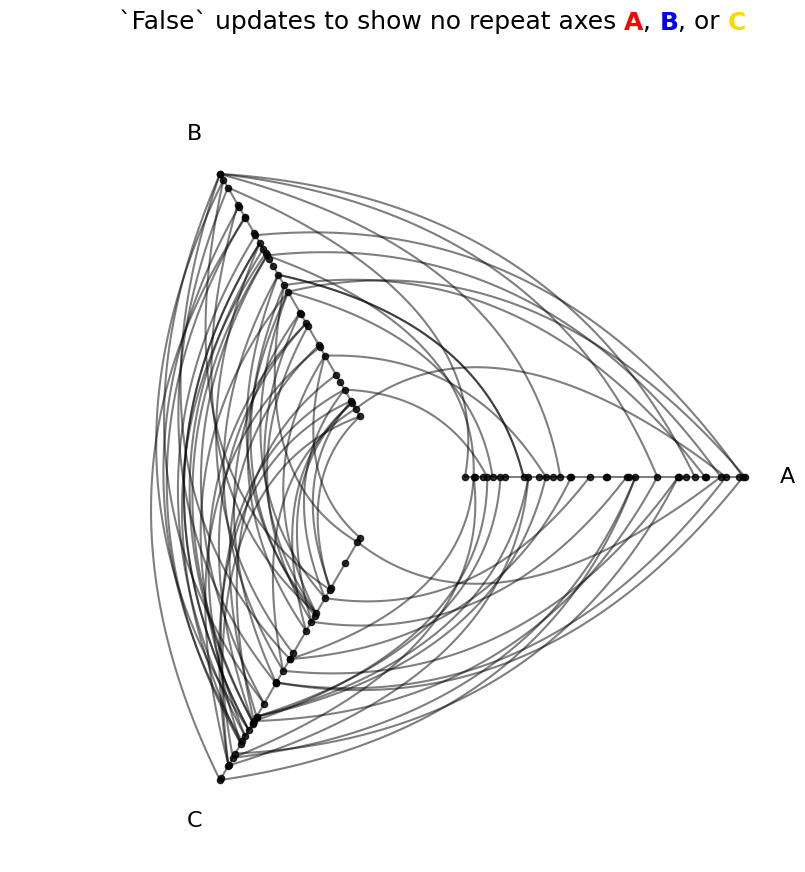
Turn Off All Repeat Axes on an Existing Hive Plot#
To turn off all repeat axes, we can run:
HivePlot.set_repeat_axes(False)
[11]:
hp_existing = example_hive_plot(
    repeat_axes="B",  # passes to HivePlot() instantiation
)

hp_existing.set_repeat_axes(False)

fig, ax = hp_existing.plot()

# embed legend in the title
flexitext(
    x=0.55,
    y=0.95,
    s="<size:18>`False` updates to show no repeat axes "
    f"<color:{INTRA_EDGE_COLORS['A']}, weight:bold>A</>, "
    f"<color:{INTRA_EDGE_COLORS['B']}, weight:bold>B</>, or "
    f"<color:{INTRA_EDGE_COLORS['C']}, weight:bold>C</>"
    "</>",
    xycoords="figure fraction",
    ha="center",
)
plt.show()
All Repeat Axes Must Have a Sorting Variable#
We must have an available sorting variable for all axes, including each repeat axis.
When setting the sorting variables (see the Setting Axis Sorting Variables page), setting a variable for all axes also includes every possible repeat axis by default:
[12]:
hp = example_hive_plot(sorting_variables="high")

hp.sorting_variables
[12]:
{'A': 'high',
 'B': 'high',
 'C': 'high',
 'A_repeat': 'high',
 'B_repeat': 'high',
 'C_repeat': 'high'}
But if we set specific sorting variables, this will not be the case:
[13]:
hp_missing_repeats = example_hive_plot(
    sorting_variables={
        "A": "low",
        "B": "med",
        "C": "high",
    },
)

hp_missing_repeats.sorting_variables
[13]:
{'A': 'low', 'B': 'med', 'C': 'high'}
When we call HivePlot.set_repeat_axes(), by default the call will fall back to using the same sorting variable for each corresponding non-repeat axis:
[14]:
hp_missing_repeats.set_repeat_axes(True)
hp_missing_repeats.sorting_variables
[14]:
{'A': 'low',
 'B': 'med',
 'C': 'high',
 'A_repeat': 'low',
 'B_repeat': 'med',
 'C_repeat': 'high'}
Modifying Repeat Axes#
Repeat axes can be modified like any other HivePlot axis; we need only specify the repeat axis specifically which will be named <axis_name>_repeat:
[15]:
hp = example_hive_plot(repeat_axes=True)
hp.update_axis(
    axis_id="A_repeat",  # need to include `_repeat` in name
    start=5,
    end=7,
)
hp.plot();
For more on modifying axes in HivePlot instances, see the Modifying Axes page.
Changing the Angle Between Repeat Axes#
To change the angle between repeat axes over the extent of the hive plot, we can change the angle_between_repeat_axes parameter on initialization:
[16]:
hp = example_hive_plot(
    repeat_axes=True,
    angle_between_repeat_axes=10,
)

for axis in INTRA_EDGE_COLORS:
    hp.update_edges(
        partition_id_1=axis,
        partition_id_2=axis,
        color=INTRA_EDGE_COLORS[axis],
        linewidth=3,
        alpha=1,
    )

fig, ax = hp.plot()

ax.set_title("Lowered angle betwen repeat axes")
plt.show()

We can also update this angle on an existing HivePlot with the HivePlot.set_angle_between_repeat_axes() method:
[17]:
hp.set_angle_between_repeat_axes(90)
hp.plot();
