

Rotating Hive Plots#
Users may want to rotate their hive plots. Users can optionally provide a rotation parameter when instantiating a new HivePlot. Alternatively, users can modify an existing HivePlot by calling the HivePlot.set_rotation() method.
This notebook demonstrates these two methods of rotating a HivePlot instance.
[1]:
import matplotlib.pyplot as plt
from hiveplotlib.datasets import example_hive_plot
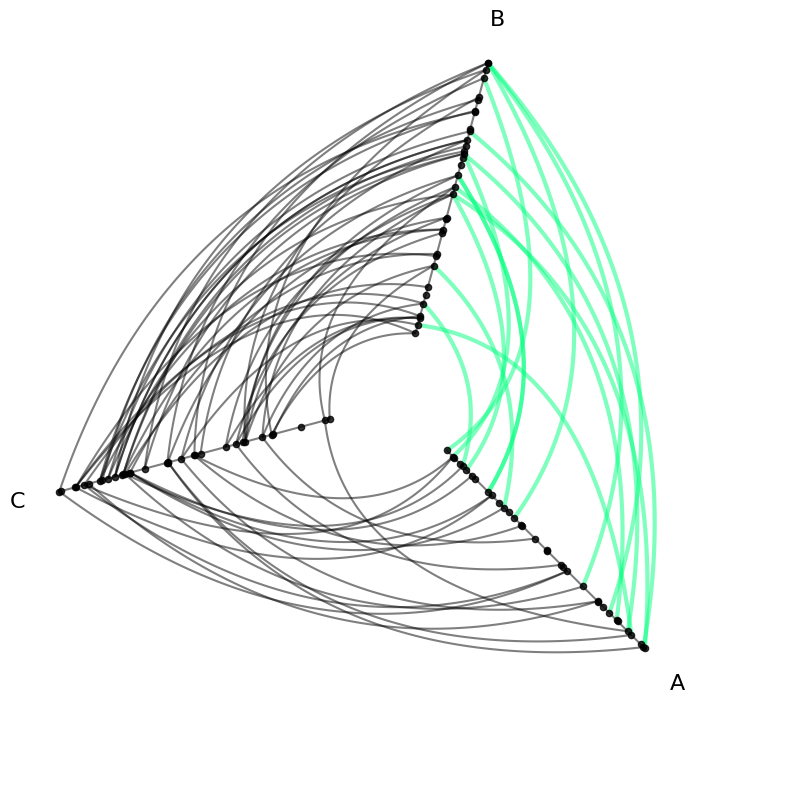
We will base this discussion on the following toy hive plot:
[2]:
hp = example_hive_plot()

# highlight one set of edges to more clearly see rotation later
highlight_edge_kwargs = {
    "color": "springgreen",
    "linewidth": 3,
}
hp.update_edges(
    partition_id_1="A",
    partition_id_2="B",
    **highlight_edge_kwargs,
)

hp.plot();

Set Rotation on a New Hive Plot#
To modify a HivePlot instance’s rotation on instantiation, we can use the rotation parameter.
The rotation parameter rotates the entire hive plot, measured in degrees counterclockwise.
Positive values will therefore rotate the hive plot counterclockwise:
[3]:
hp_ccw = example_hive_plot(rotation=45)

# highlight same set of edges as above
hp_ccw.update_edges(
    partition_id_1="A",
    partition_id_2="B",
    **highlight_edge_kwargs,
)

hp_ccw.plot();

And negative values will rotate the hive plot clockwise:
[4]:
hp_cw = example_hive_plot(rotation=-45)

# highlight same set of edges as above
hp_cw.update_edges(
    partition_id_1="A",
    partition_id_2="B",
    **highlight_edge_kwargs,
)

hp_cw.plot();
Set Rotation on an Existing Hive Plot#
To modify an existing HivePlot instance’s rotation, we can call the HivePlot.set_rotation() method.
This call rotates the entire hive plot, measuring in degrees counterclockwise.
Positive values will therefore rotate the hive plot counterclockwise:
[5]:
hp = example_hive_plot()

# highlight same set of edges as above
hp.update_edges(
    partition_id_1="A",
    partition_id_2="B",
    **highlight_edge_kwargs,
)

fig, axes = plt.subplots(1, 2, figsize=(10, 4))

hp.plot(ax=axes.flatten()[0])
axes.flatten()[0].set_title("Original Hive Plot", y=1.2)

hp.set_rotation(rotation=45)

hp.plot(ax=axes.flatten()[1])
axes.flatten()[1].set_title("Rotated Hive Plot", y=1.2)

plt.show()

And negative values will rotate the hive plot clockwise:
[6]:
hp = example_hive_plot()

# highlight same set of edges as above
hp.update_edges(
    partition_id_1="A",
    partition_id_2="B",
    **highlight_edge_kwargs,
)

fig, axes = plt.subplots(1, 2, figsize=(10, 4))

hp.plot(ax=axes.flatten()[0])
axes.flatten()[0].set_title("Original Hive Plot", y=1.2)

hp.set_rotation(rotation=-45)

hp.plot(ax=axes.flatten()[1])
axes.flatten()[1].set_title("Rotated Hive Plot", y=1.2)

plt.show()
