

Setting a Partition Variable#
Hive plots require a partition variable to dictate how the nodes should be split onto multiple axes.
When instantiating a new HivePlot object, users must therefore provide a partition_variable corresponding to a column name in the provided node data.
Users can also modify an existing HivePlot’s partition by calling the HivePlot.set_partition() method.
This notebook demonstrates these two methods of setting the partition variable with the HivePlot class.
[1]:
import matplotlib as mpl
import matplotlib.pyplot as plt
import seaborn as sns
from hiveplotlib import HivePlot
from hiveplotlib.datasets import example_hive_plot
We will base this discussion on the following toy hive plot:
[2]:
hp = example_hive_plot()
# point node color to node data column name
node_kwargs = {
"c": "low", # setting the color as the node dataframe column name
"cmap": "magma",
"vmin": 0, # keep the min color the same for all nodes
"vmax": 10, # keep the max color the same for all nodes
"s": 100, # larger nodes so we can see the color better
"edgecolor": "black",
}
fig, ax = hp.plot(node_kwargs=node_kwargs)
# add custom colorbar to plot
fig.colorbar(
mpl.cm.ScalarMappable(
norm=mpl.colors.Normalize(
node_kwargs["vmin"],
node_kwargs["vmax"],
),
cmap=node_kwargs["cmap"],
),
ax=ax,
shrink=0.7,
label="Node Variable 'low'",
)
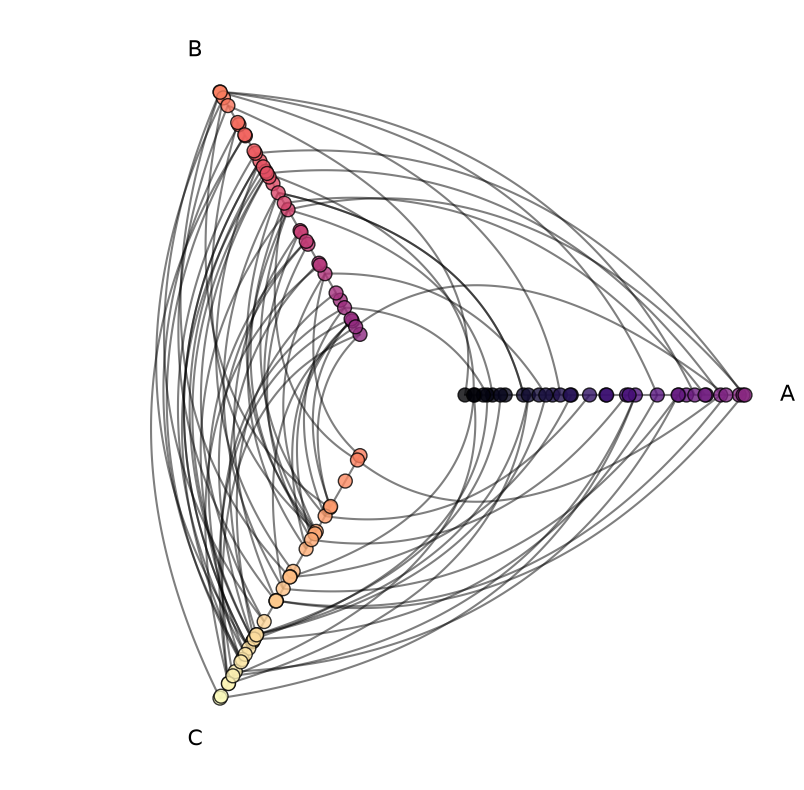
ax.set_title(
"Example Hive Plot\nColoring Nodes Based on Each Node's 'low' Variable",
)
plt.show()

Before we discuss how to set a partition, let’s discuss why the above example has the color patterns with its nodes.
First, let’s note the underlying node data for this example:
[3]:
hp.nodes.data
[3]:
| unique_id | low | med | high | partition_0 | |
|---|---|---|---|---|---|
| 0 | 0 | 6.363247 | 14.795079 | 23.193620 | B |
| 1 | 1 | 2.695169 | 12.321405 | 21.873202 | A |
| 2 | 2 | 0.409326 | 18.010787 | 26.718541 | A |
| 3 | 3 | 0.165111 | 19.226066 | 21.949123 | A |
| 4 | 4 | 8.124570 | 12.658641 | 25.771102 | C |
| ... | ... | ... | ... | ... | ... |
| 95 | 95 | 9.562530 | 15.708242 | 25.857141 | C |
| 96 | 96 | 1.486152 | 10.064025 | 21.225680 | A |
| 97 | 97 | 9.716562 | 17.718766 | 29.328351 | C |
| 98 | 98 | 8.890456 | 19.772874 | 26.833664 | C |
| 99 | 99 | 8.215515 | 15.892802 | 28.229576 | C |
100 rows × 5 columns
The example hive plot above was partitioned into axes according to partition_0.
By design, that partition was creating using the same node variable (low) that we are using to color the nodes.
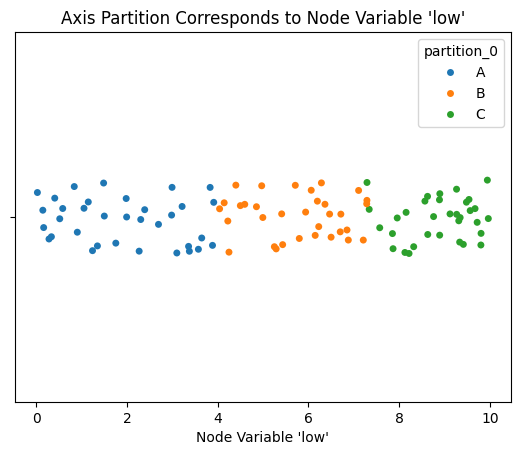
To clarify this visually, below we show a plot of the node low values corresponding to each hive plot axis, which show’s the A-axis low values tend to be lower than the B values, which tend to be lower than the C values:
[4]:
fig, ax = plt.subplots()
sns.stripplot(
    data=hp.nodes.data,
    x="low",
    hue="partition_0",
    ax=ax,
    hue_order=["A", "B", "C"],
)
ax.set_xlabel("Node Variable 'low'")
ax.set_title("Axis Partition Corresponds to Node Variable 'low'")
plt.show()
We also see the color values increasing along each axis in the above hive plot visualization because this toy example is sorting nodes on each axis by the value low, which we can see by examining the sorting_variables attribute:
[5]:
hp.sorting_variables
[5]:
{'A': 'low',
 'B': 'low',
 'C': 'low',
 'A_repeat': 'low',
 'B_repeat': 'low',
 'C_repeat': 'low'}
Next, let’s discuss the two ways we can set the partition variable for a HivePlot instance.
Set Partition Variable on a New Hive Plot#
Instantiating a HivePlot requires:
Nodes
Edges
A node partition variable, and
A node sorting variable.
Let’s recreate the above HivePlot instance without calling example_hive_plot().
First, we will borrow the nodes and edges from the above example:
[6]:
nodes = hp.nodes.copy()
edges = hp.edges.copy()
Next, for the partition variable, we want to partition the low values into 3 axes.
We need to create this partition variable and save it in the node data first, which can be done via the NodeCollection.create_partition_variable() method:
[7]:
low_partition_variable_name = nodes.create_partition_variable(
    data_column="low",
    cutoffs=3,  # partition into 3 axes
    labels=["A", "B", "C"],  # keep axis names the same
    partition_variable_name="my_new_partition",
)
For more on creating partition variables, see the Creating a Partition Variable page.
Finally, for the sorting variable, we will be consistent with the above example, setting all the axis sorting variables to low.
[8]:
sorting_variable = "low"
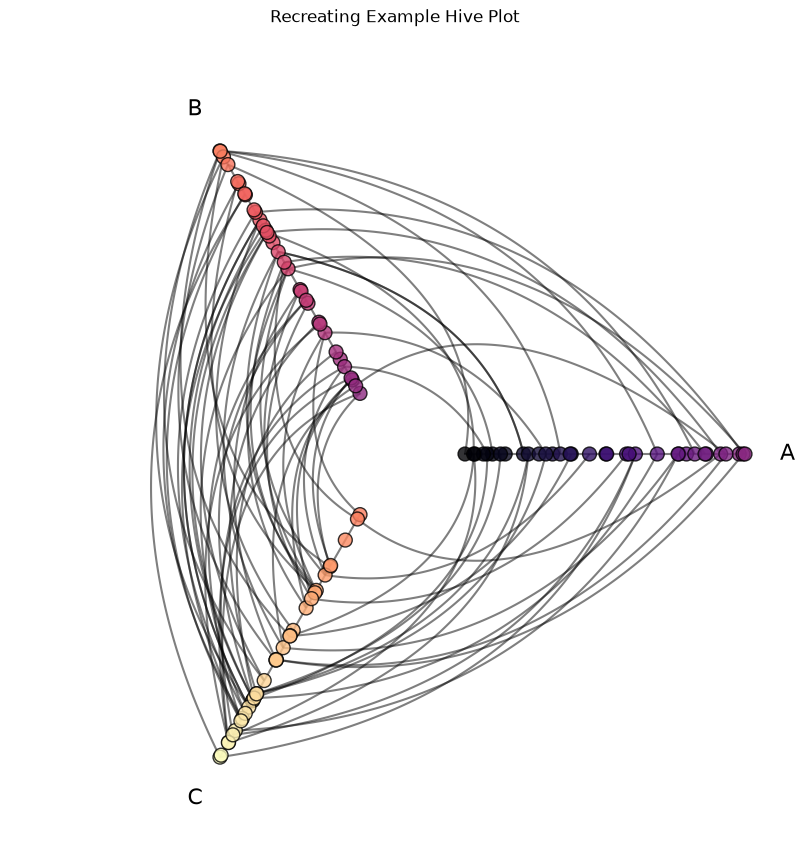
With those four inputs, we can instantiate a new HivePlot object with equivalent plotting results to the above example:
[9]:
new_hp = HivePlot(
    nodes=nodes,
    edges=edges,
    partition_variable=low_partition_variable_name,
    sorting_variables=sorting_variable,
)

# do equivalent plotting to above example
fig, ax = new_hp.plot(node_kwargs=node_kwargs)

ax.set_title(
    "Recreating Example Hive Plot",
    y=1.05,
)
plt.show()
We could use any partition variable we want from the underlying NodeCollection. What would happen if we instead partitioned by the node unique IDs?
Note there’s no relationship between node IDs and the corresponding low values:
[10]:
fig, ax = plt.subplots()
ax.scatter(nodes.data[nodes.unique_id_column], nodes.data.low)
ax.set_xlabel("Node ID")
ax.set_ylabel("Node 'low' Value")
ax.set_title("No relationship between node ID and node 'low' value")
plt.show()
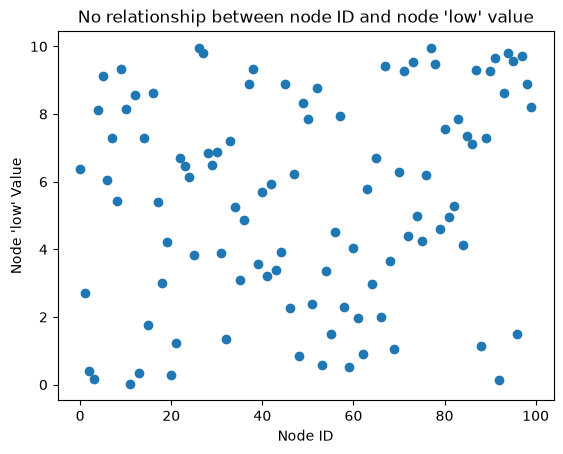
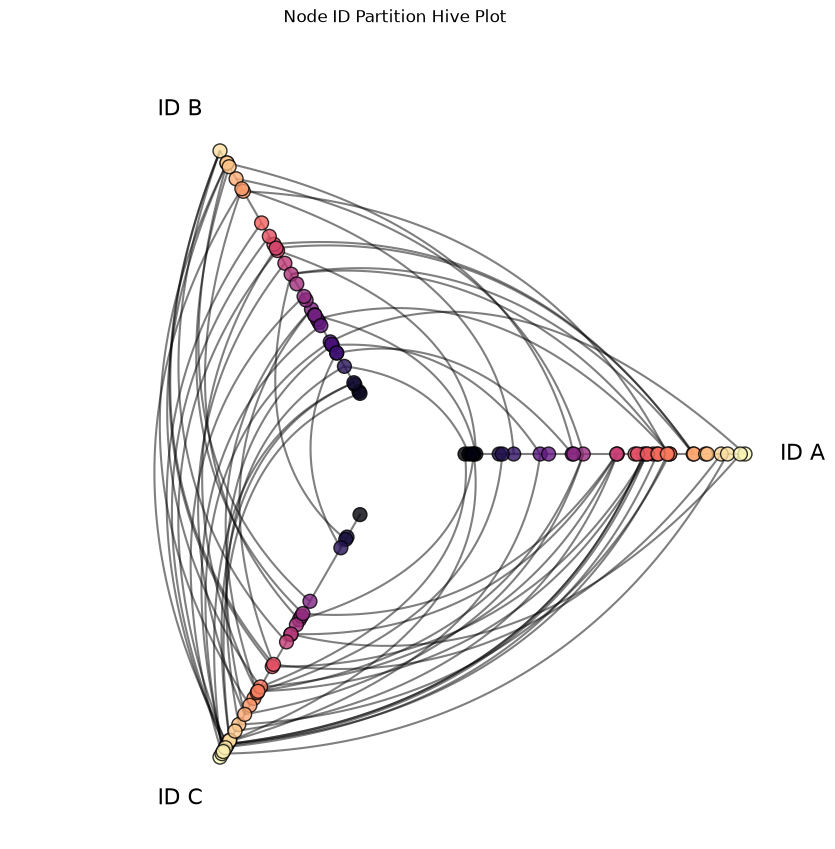
which means if we partition according to node IDs, then each axis should have comparable node color representation (though the within-axis sorting will be preserved):
[11]:
node_id_partition_variable = nodes.create_partition_variable(
    data_column=nodes.unique_id_column,
    cutoffs=3,  # still partition into 3 axes
    labels=["ID A", "ID B", "ID C"],
    partition_variable_name="my_node_id_partition",
)

node_sorted_hp = HivePlot(
    nodes=nodes,
    edges=edges,
    partition_variable=node_id_partition_variable,  # use new partition
    sorting_variables=sorting_variable,
)

# do equivalent plotting to above example
fig, ax = node_sorted_hp.plot(node_kwargs=node_kwargs)

ax.set_title(
    "Node ID Partition Hive Plot",
    y=1.05,
)
plt.show()
Set Partition Variable on an Existing Hive Plot#
For an existing HivePlot, we need change its partition by calling HivePlot.set_partition().
Let’s take our node ID-sorted hive plot from above and switch its partition back to our low_partition_variable_name partition variable that we created above, which is equivalent to our original hive plot partition:
[12]:
node_sorted_hp.set_partition(
    partition_variable=low_partition_variable_name,
    sorting_variables=sorting_variable,  # must specify sorting variables for new partition
)

# do equivalent plotting to original example
fig, ax = node_sorted_hp.plot(node_kwargs=node_kwargs)

plt.show()
Since this partition change requires reallocating all nodes to newly-generated axes, the set_partition() call also requires specifying the sorting_variables parameter. Since we’re drawing new axes with the call, hiveplotlib will not assume how we want to sort and place the nodes on our new axes.
Note, if we were previously considering repeat axes, this call would require us to specify if / which repeat_axes we want. By default, as is done in the instantiation of a HivePlot instance, if not specified, no repeat axes will be drawn.
Using Node Graph Metrics as Partition Variables#
Node graph metrics can also be used to partition network data.
Most node graph metrics, however, are continuous, so we need to discretize them into bins before using as a partition via NodeCollection.create_partition_variable() (as we did with the low column above). If we skip this discretization step, then we will get one axis per unique node graph metric value, which does not make an informative hive plot.
This requires us to use lower-level Hiveplotlib helper functions to first create and then modify the Hiveplotlib NodeCollection before instantiating a HivePlot.
For an example using node degree as a partition variable, see the Using a Computed Metric as a Partition Variable section of the Computing Graph Metrics page.