

Graph Metric Backends#
Hiveplotlib computes graph metrics through networkx, which supports dispatchable backends: plugin packages like nx-parallel (CPU parallelism) and nx-cugraph (GPU) that provide accelerated implementations of networkx algorithms. On large graphs, routing metric computation through one of these backends can speed it up
considerably.
The graph_metric_backend parameter requests a backend by name. It is available on HivePlot, HivePlotMatrix, and the standalone compute_graph_metrics() function. This notebook demonstrates the parameter, per-metric overrides, surfacing fallback notices with logging, and networkx’s own backend priority configuration as an alternative route.
Note: this notebook requires that Hiveplotlib be installed with extra packages, which can be done by running:
pip install hiveplotlib[networkx]
Backend dispatch requires networkx>=3.2. The demonstrations below also use nx-parallel:
pip install nx-parallel
graph_metric_backend accepts the registered name of any installed dispatchable backend, not just nx-parallel.
[1]:
import logging

import matplotlib.pyplot as plt
import networkx as nx
from hiveplotlib import HivePlot
from hiveplotlib.converters import networkx_to_nodes_edges
from hiveplotlib.exceptions import InvalidGraphMetricBackendError
from hiveplotlib.graph_features import compute_graph_metrics
from matplotlib.cm import ScalarMappable
from matplotlib.colors import Normalize
We will use Zachary’s Karate Club graph below. It is far too small to need an accelerated backend; we use it only to demonstrate the mechanics.
[2]:
G = nx.karate_club_graph()
The graph_metric_backend Parameter#
Passing the graph_metric_backend parameter at HivePlot initialization routes every requested graph metric through the named backend. Backends register under names that differ from their pip package names: nx-parallel registers as "parallel", nx-cugraph as "cugraph".
[3]:
hp = HivePlot(
    graph=G,
    partition_variable="club",
    sorting_variables="betweenness_centrality",
    node_graph_metrics="betweenness_centrality",
    graph_metric_backend="parallel",
)
hp.nodes.data.head()
[3]:
| unique_id | club | betweenness_centrality | |
|---|---|---|---|
| 0 | 0 | Mr. Hi | 0.437635 |
| 1 | 1 | Mr. Hi | 0.053937 |
| 2 | 2 | Mr. Hi | 0.143657 |
| 3 | 3 | Mr. Hi | 0.011909 |
| 4 | 4 | Mr. Hi | 0.000631 |
The backend changes which engine does the work, not the result; the computed column matches what default networkx produces. The construction value is also stored, so later HivePlot.compute_graph_metrics() calls on this hive plot reuse "parallel" unless overridden per call.
The degree, in_degree, and out_degree metrics are direct structural reads of the graph, so backend dispatch does not apply to them; a global backend silently skips them (the result is identical either way).
Backend Names Are Validated Up Front#
Unknown or uninstalled backend names raise an InvalidGraphMetricBackendError before any metric is computed. The common stumble is passing the pip package name where the registry name belongs:
[4]:
import traceback

try:
    HivePlot(
        graph=G,
        partition_variable="club",
        sorting_variables="degree_centrality",
        node_graph_metrics="degree_centrality",
        graph_metric_backend="nx-parallel",  # should be "parallel"
    )
except InvalidGraphMetricBackendError:
    traceback.print_exc()
Traceback (most recent call last):
  File "/tmp/ipykernel_1896915/355322967.py", line 4, in <module>
    HivePlot(
  File "/home/garyk/repos/hiveplotlib/src/hiveplotlib/hiveplot.py", line 2264, in __init__
    self._apply_graph_metrics(
  File "/home/garyk/repos/hiveplotlib/src/hiveplotlib/hiveplot.py", line 2478, in _apply_graph_metrics
    new_nodes, new_edges = compute_graph_metrics(
                           ^^^^^^^^^^^^^^^^^^^^^^
  File "/home/garyk/repos/hiveplotlib/src/hiveplotlib/graph_features/__init__.py", line 731, in compute_graph_metrics
    _validate_graph_metric_backends(
  File "/home/garyk/repos/hiveplotlib/src/hiveplotlib/graph_features/__init__.py", line 421, in _validate_graph_metric_backends
    raise InvalidGraphMetricBackendError(msg)
hiveplotlib.exceptions.hive_plot.InvalidGraphMetricBackendError: Unknown graph metric backend(s) ['nx-parallel']. Installed dispatchable backends: ['parallel']. Note that backends register under names that differ from their pip package names (nx-parallel registers as 'parallel', nx-cugraph as 'cugraph').
Per-Metric Overrides#
A per-metric "backend" entry in node_graph_metric_kwargs overrides graph_metric_backend for that one metric, whatever its value. One special case is an explicit "backend": None, which opts that single metric back to default networkx even when graph_metric_backend requests one for everything else. The edge_graph_metric_kwargs parameter (and edge_metric_kwargs on compute_graph_metrics()) carries the same reserved "backend" key for edge metrics.
[5]:
hp_override = HivePlot(
    graph=G,
    partition_variable="club",
    sorting_variables="degree",
    node_graph_metrics=[
        "degree",
        "betweenness_centrality",
        "pagerank",
    ],
    # opt pagerank back to default networkx
    node_graph_metric_kwargs={"pagerank": {"backend": None}},
    edge_graph_metrics="edge_betweenness_centrality",
    # the edge side carries the same reserved "backend" key
    edge_graph_metric_kwargs={
        "edge_betweenness_centrality": {"backend": None},
    },
    graph_metric_backend="parallel",
)
hp_override.nodes.data.head()
[5]:
| unique_id | club | degree | betweenness_centrality | pagerank | |
|---|---|---|---|---|---|
| 0 | 0 | Mr. Hi | 16 | 0.437635 | 0.088508 |
| 1 | 1 | Mr. Hi | 9 | 0.053937 | 0.057415 |
| 2 | 2 | Mr. Hi | 10 | 0.143657 | 0.062767 |
| 3 | 3 | Mr. Hi | 6 | 0.011909 | 0.037212 |
| 4 | 4 | Mr. Hi | 3 | 0.000631 | 0.020504 |
In this call:
betweenness_centralitydispatches to"parallel".pagerankandedge_betweenness_centralityrun on defaultnetworkxvia their explicitNoneentries.degreeis a direct structural read and never dispatches.
A per-metric "backend" entry can also name a specific backend, not just opt out with None. For example, {"pagerank": {"backend": "cugraph"}} would send that one metric to a GPU backend while the rest follow the call’s graph_metric_backend.
Backends are chosen in this order of precedence (highest first):
A per-metric
"backend"entry.The per-call
graph_metric_backend.The
graph_metric_backendvalue stored at theHivePlot/HivePlotMatrixinitialization.
Surfacing Fallback Notices with Logging#
Not every backend implements every metric. When the requested backend does not implement a metric, Hiveplotlib falls back to default networkx for that metric. The library is silent by default, but one line of standard logging configuration makes the fallback notices visible:
[6]:
logging.basicConfig(level=logging.INFO)
The standalone compute_graph_metrics() function accepts the same graph_metric_backend parameter. At the time of writing, nx-parallel does not implement pagerank, so requesting it under the "parallel" backend triggers an INFO-level log line:
[7]:
nodes, edges = networkx_to_nodes_edges(G)

new_nodes, new_edges = compute_graph_metrics(
    G,
    node_metrics="pagerank",
    target_nodes=nodes,
    target_edges=edges,
    graph_metric_backend="parallel",
)
new_nodes.data.head()
INFO:hiveplotlib.graph_features:Metric 'pagerank' is not implemented by the 'parallel' backend for these arguments; falling back to default networkx.
[7]:
| unique_id | club | pagerank | |
|---|---|---|---|
| 0 | 0 | Mr. Hi | 0.088508 |
| 1 | 1 | Mr. Hi | 0.057415 |
| 2 | 2 | Mr. Hi | 0.062767 |
| 3 | 3 | Mr. Hi | 0.037212 |
| 4 | 4 | Mr. Hi | 0.020504 |
The result is still correct: the fallback computed pagerank on default networkx, but we won’t get the speedup for that one metric. To see successful dispatches to the non-networkx backend, we can set the log level to DEBUG:
[8]:
hpl_logger = logging.getLogger("hiveplotlib.graph_features")
hpl_logger.setLevel(logging.DEBUG)

nodes, edges = networkx_to_nodes_edges(G)

new_nodes, new_edges = compute_graph_metrics(
    G,
    node_metrics="betweenness_centrality",
    target_nodes=nodes,
    target_edges=edges,
    graph_metric_backend="parallel",
)

hpl_logger.setLevel(logging.INFO)  # restore so later cells stay quiet
new_nodes.data.head()
DEBUG:hiveplotlib.graph_features:Metric 'betweenness_centrality' dispatched to the 'parallel' backend.
[8]:
| unique_id | club | betweenness_centrality | |
|---|---|---|---|
| 0 | 0 | Mr. Hi | 0.437635 |
| 1 | 1 | Mr. Hi | 0.053937 |
| 2 | 2 | Mr. Hi | 0.143657 |
| 3 | 3 | Mr. Hi | 0.011909 |
| 4 | 4 | Mr. Hi | 0.000631 |
NetworkX’s Backend Priority Configuration#
networkx itself allows us to change the default backend for all dispatchable graph metrics by setting the NETWORKX_BACKEND_PRIORITY environment variable before networkx is imported.
For example, if we wanted to make nx-parallel the default backend, we could run:
export NETWORKX_BACKEND_PRIORITY=parallel
Or, we can equivalently run the following at the start of our Python code:
nx.config.backend_priority.algos = ["parallel"]
networkx will then try this backend first for each dispatchable call, Hiveplotlib’s metric computations included, and silently run its default implementation when the backend does not implement the function. This route trades control for convenience relative to the graph_metric_backend parameter: no up-front validation of backend names, no per-metric control, and silent fallbacks with no log lines.
Plotting the Computed Metrics#
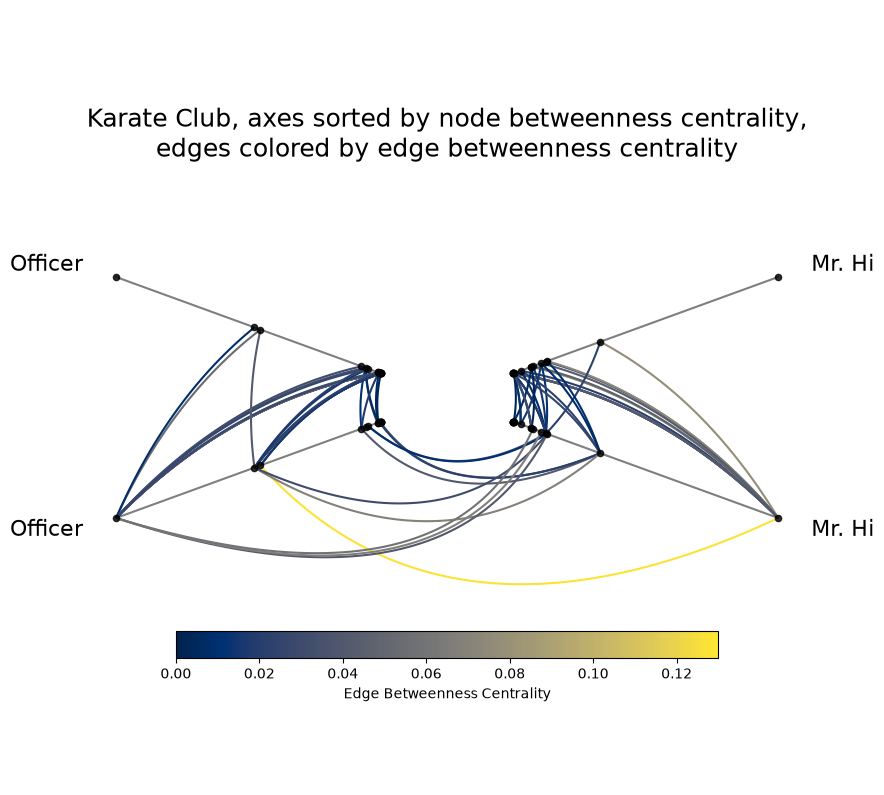
A backend changes how metrics are computed, not what they are; the resulting columns plot like any other node or edge data. Below, we sort each axis by betweenness_centrality and color edges by edge_betweenness_centrality, both computed via nx-parallel. The layout sets repeat_axes=True so that intra-group edges can be drawn (see Adding and Modifying Repeat Axes).
[9]:
hp_viz = HivePlot(
    graph=G,
    partition_variable="club",
    sorting_variables="betweenness_centrality",
    node_graph_metrics="betweenness_centrality",
    graph_metric_backend="parallel",
    repeat_axes=True,
)

# with two groups and repeat axes, one inter-group edge set is redundant
#  so we drop one
hp_viz.reset_edges(axis_id_1="Mr. Hi_repeat", axis_id_2="Officer")

# the stored "parallel" backend from construction is reused here
hp_viz.compute_graph_metrics(
    edge_graph_metrics="edge_betweenness_centrality",
)
[10]:
edge_coloring_kwargs = {
    "cmap": "cividis",
    "clim": (0, 0.13),
    "alpha": 1,
}

# color edges by edge_betweenness_centrality value
hp_viz.update_edge_plotting_keyword_arguments(
    array="edge_betweenness_centrality",
    **edge_coloring_kwargs,
)

fig, ax = hp_viz.plot()

# add custom colorbar to plot
fig.colorbar(
    ScalarMappable(
        norm=Normalize(*edge_coloring_kwargs["clim"]),
        cmap=edge_coloring_kwargs["cmap"],
    ),
    orientation="horizontal",
    ax=ax,
    shrink=0.7,
    label="Edge Betweenness Centrality",
    pad=-0.2,
)

ax.set_title(
    "Karate Club, axes sorted by node betweenness centrality,\n"
    "edges colored by edge betweenness centrality",
    y=0.8,
    size=18,
)
plt.show()
For more on the available node and edge metrics and their per-metric keyword arguments, see the Computing Graph Metrics page.
For working with networks large enough to benefit from an accelerated backend, see the Hive Plots for Large Networks tutorial.