Matplotlib#
This notebook discusses how to use the HivePlot class with the default matplotlib visualization back end.
[1]:
import matplotlib.pyplot as plt
from hiveplotlib.datasets import example_hive_plot
from matplotlib.cm import ScalarMappable
from matplotlib.colors import Normalize
Change Plotting Kwargs For Nodes, Edges, and Axes#
By default, Hiveplotlib viz keeps all colors black, with standardized sizes that should cover most users’ needs:
[2]:
hp = example_hive_plot()

fig, ax = hp.plot()
ax.set_title("Base Default Matplotlib Hive Plot Viz")
plt.show()

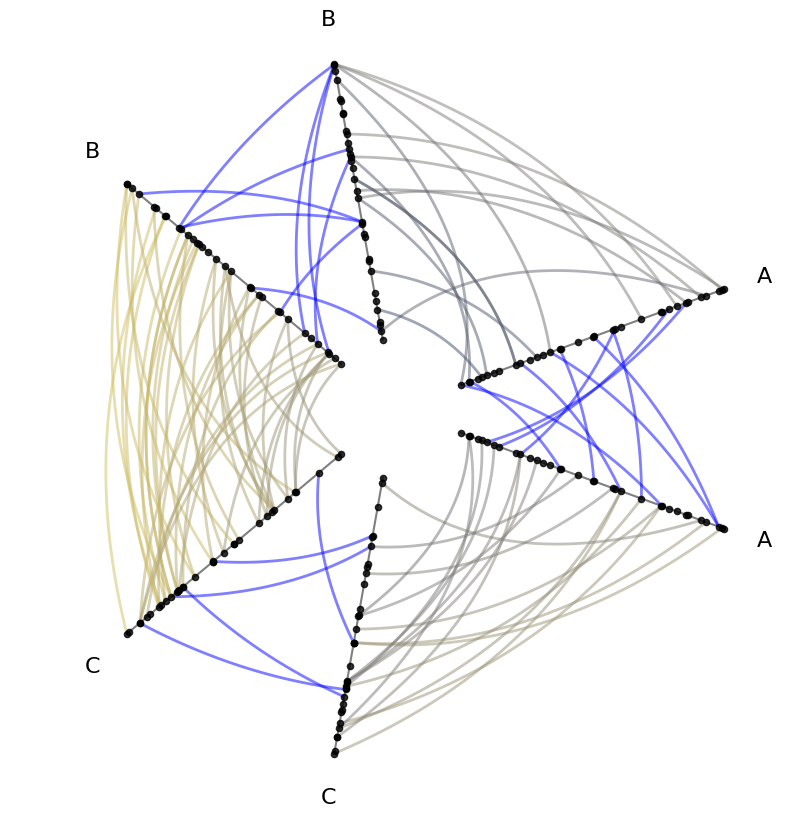
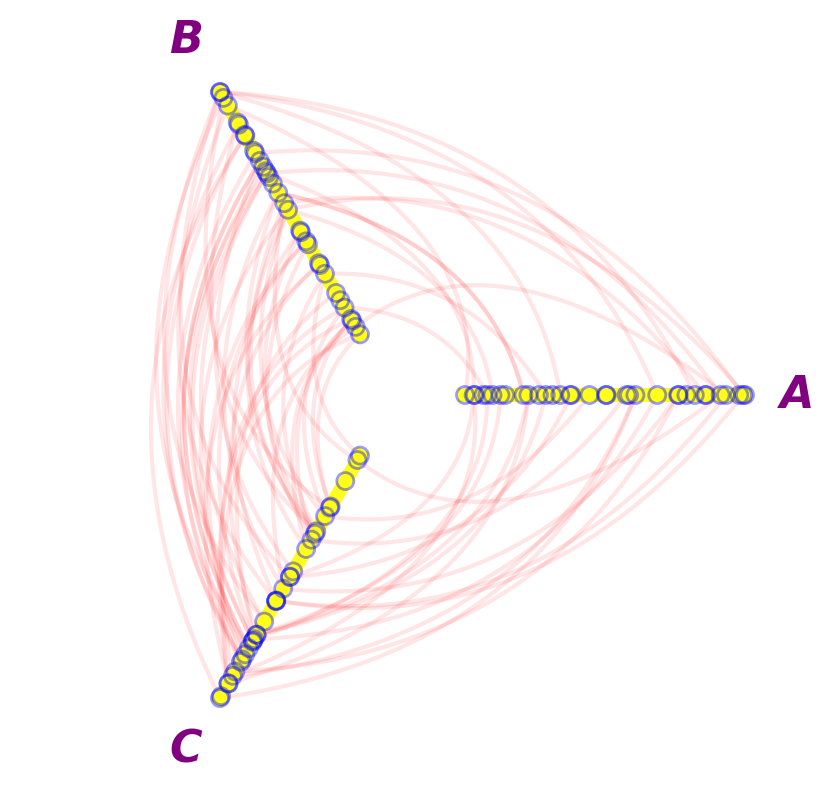
All of these defaults, however, can be modified. Below, we modify every color and size to serve as a reference for how to change these defaults with the matplotlib back end:
[3]:
hp.plot(
    # node kwarg changes
    node_kwargs={
        "s": 150,
        "color": "None",  # empty node fill color
        "edgecolor": "blue",
        "linewidth": 2,
        "alpha": 0.4,
    },
    # axes label kwarg changes
    axes_labels_fontsize=32,
    text_kwargs={
        "color": "purple",
        "weight": "bold",
        "style": "italic",
    },
    # axes kwarg changes
    axes_kwargs={
        "linewidth": 10,
        "color": "yellow",
        "alpha": 0.9,
    },
    # edge kwarg changes
    color="red",
    linewidth=3,
    alpha=0.1,
);
Plotting Node Metadata#
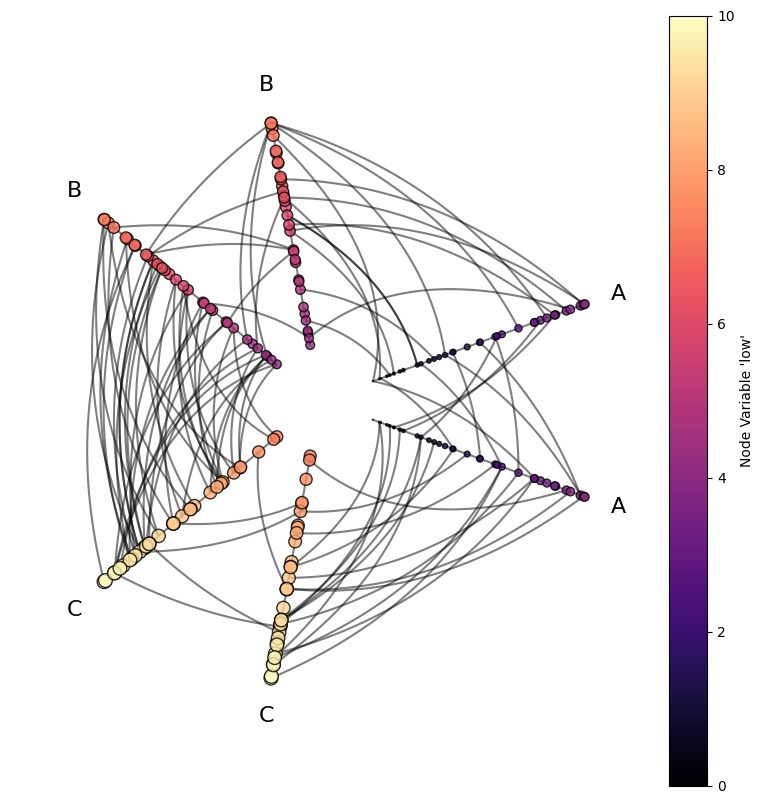
Users may want to visualize nodes with respect to node metadata. For more on visualizing node metadata, see the Visualizing Node Metadata page.
Below, we demonstrate modifying nodes according to metadata for both size and color.
[4]:
hp = example_hive_plot(
    repeat_axes=True,
)

# scale the low variable to make more useful sizes in viz
hp.nodes.data["size"] = hp.nodes.data["low"].to_numpy() * 10

# propagate extra node data changes through to data on axes
hp.update_partition_data()

node_kwargs = {
    "c": "low",  # reference to "low" var in node data
    "s": "size",  # reference to "size" var in node data
    "edgecolor": "black",
    "cmap": "magma",
    "clim": (0, 10),  # fixed color range consistent between each axis
}

hp.update_node_viz_kwargs(**node_kwargs)

fig, ax = hp.plot()

# custom colorbar
norm = Normalize(
    vmin=node_kwargs["clim"][0],
    vmax=node_kwargs["clim"][1],
)
fig.colorbar(
    ScalarMappable(norm=norm, cmap=node_kwargs["cmap"]),
    ax=ax,
    label="Node Variable 'low'",
)
plt.show()
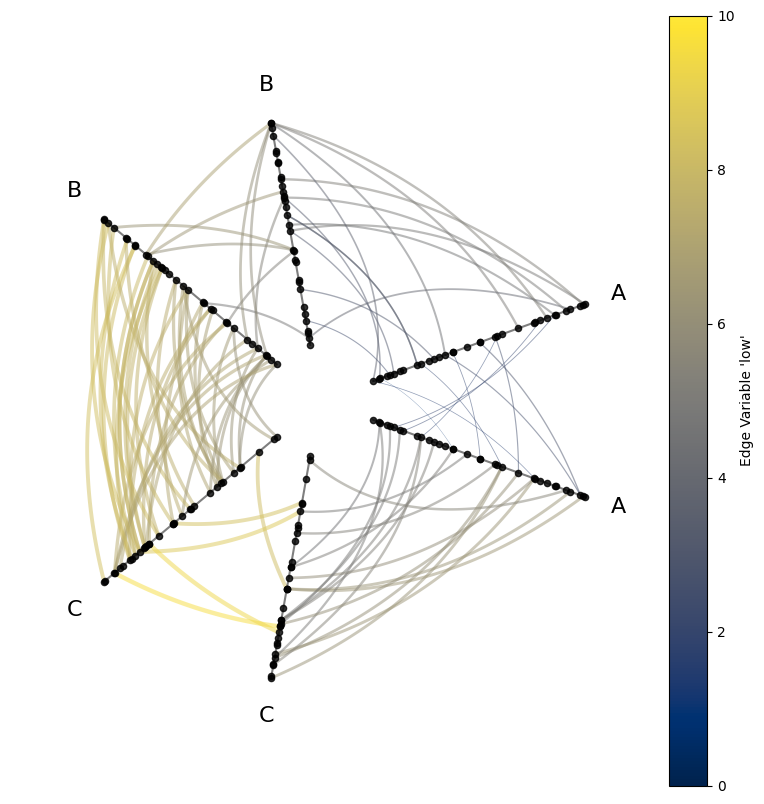
Plotting Edge Metadata#
Users may want to visualize edges with respect to edge metadata. For more on visualizing edge metadata, see the Visualizing Edge Metadata page.
Below, we demonstrate modifying edges according to metadata for both line width and color. Note when setting edge color with metadata with the matplotlib back end, the parameter name is an unintuitive array.
[5]:
hp = example_hive_plot(
    repeat_axes=True,
    backend="matplotlib",
)

# scale the low variable to make more useful line widths in viz
hp.edges.data["linewidth"] = hp.edges.data["low"] / 3

# unexpected edge color name `array` with matplotlib back end
edge_kwargs = {
    "array": "low",  # reference to "low" var in edge data
    "linewidth": "linewidth",  # reference to "linewidth" variable in edge data
    "clim": (0, 10),  # fixed color range consistent between each axis
    "cmap": "cividis",
}

hp.update_edge_plotting_keyword_arguments(**edge_kwargs)

fig, ax = hp.plot()

# custom colorbar
norm = Normalize(
    vmin=edge_kwargs["clim"][0],
    vmax=edge_kwargs["clim"][1],
)
fig.colorbar(
    ScalarMappable(norm=norm, cmap=edge_kwargs["cmap"]),
    ax=ax,
    label="Edge Variable 'low'",
)
plt.show()
Kwarg Priority When Including Both array and color#
When using the default matplotlib back end, we must plot edge metadata using the array parameter, but plotting with fixed colors must be done with the color parameter.
When providing both color and array inputs for edge color, Hiveplotlib by default handles this conflict by prioritizing the array input for color mapping, regardless of what color is specified:
[6]:
hp = example_hive_plot(
    repeat_axes=True,
    backend="matplotlib",
)

# color by `array` with matplotlib back end
edge_kwargs = {
    "linewidth": 2,
    "array": "low",  # reference to "low" var in edge data
    "clim": (0, 10),  # fixed color range consistent between each axis
    "cmap": "cividis",
}

hp.update_edge_plotting_keyword_arguments(**edge_kwargs)

# we want to color just the repeat axes differently
hp.update_edge_plotting_keyword_arguments(
    edge_kwarg_setting="repeat_edge_kwargs",
    color="blue",
)

# by default, this will prioritize `array` over `color`
#  i.e. no blue repeat edges in plot
hp.plot();
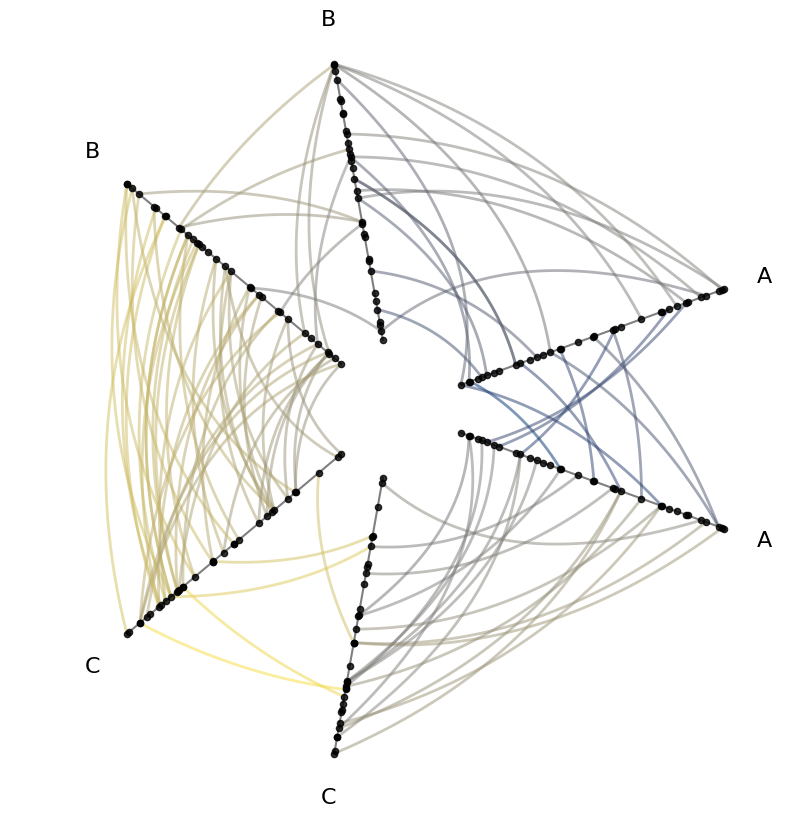
However, users can instead prioritize the color parameter over the array parameter by setting prioritize_array_over_color=False when plotting:
[7]:
# force prioritizing `color` over `array`
hp.plot(
    prioritize_array_over_color=False,
);